| Red | Green | Blue | |
| z | 17.64 | ||
| znorm | Inf | ||
| sky | -Inf | -Inf | -Inf |
| S/N | 17.8 | 32.3 | 40.1 |
| S/N(c) | 0.0 | 0.0 | 0.0 |
| SN(E/C) |
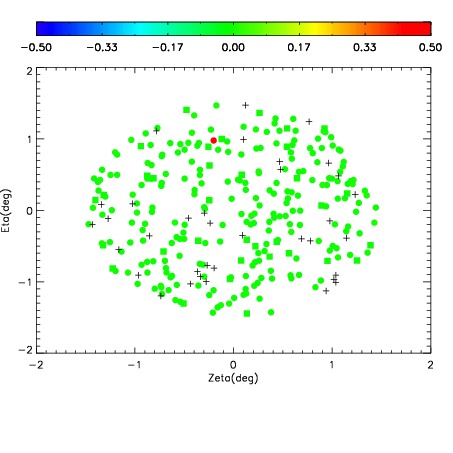
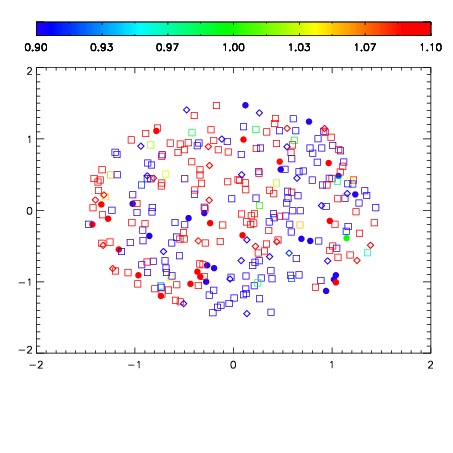
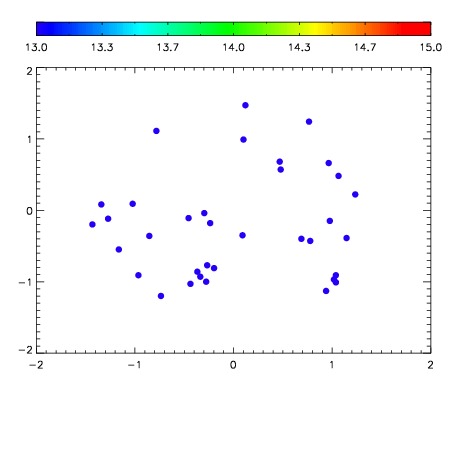

| Frame | Nreads | Zeropoints | Mag plots | Spatial mag deviation | Spatial sky 16325A emission deviations (filled: sky, open: star) | Spatial sky continuum emission | Spatial sky telluric CO2 absorption deviations (filled: H < 10) | |||||||||||||||||||||||
| 0 | 0 |
|
|
|
|
|
|
| IPAIR | NAME | SHIFT | NEWSHIFT | S/N | NAME | SHIFT | NEWSHIFT | S/N |
| 0 | 03760057 | 0.511918 | 0.00000 | 164.520 | 03760054 | 0.00132009 | 0.510598 | 174.767 |
| 1 | 03760056 | 0.510771 | 0.00114703 | 180.231 | 03760055 | 0.000209893 | 0.511708 | 199.484 |
| 2 | 03760052 | 0.508721 | 0.00319701 | 178.722 | 03760058 | 0.000376331 | 0.511542 | 192.811 |
| 3 | 03760053 | 0.509872 | 0.00204599 | 165.681 | 03760051 | 0.00000 | 0.511918 | 178.951 |