| Red | Green | Blue | |
| z | 17.64 | ||
| znorm | Inf | ||
| sky | -Inf | -Inf | -Inf |
| S/N | 28.3 | 45.4 | 54.7 |
| S/N(c) | 0.0 | 0.0 | 0.0 |
| SN(E/C) |

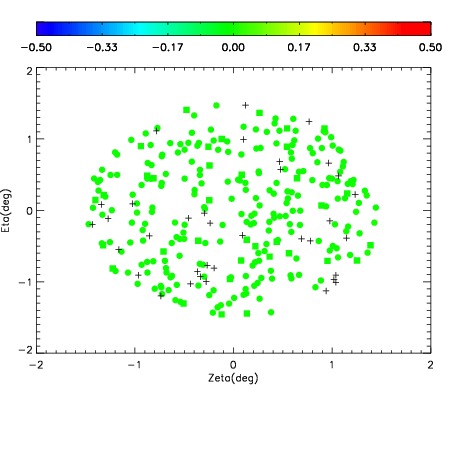
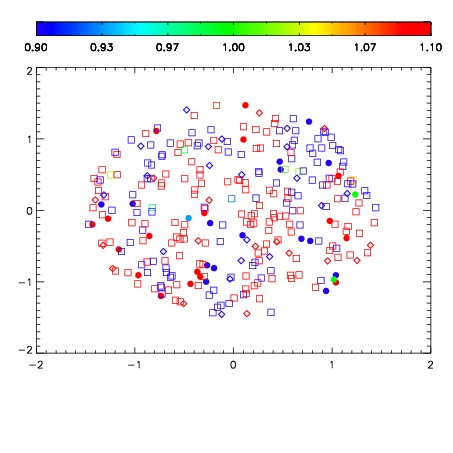


| Frame | Nreads | Zeropoints | Mag plots | Spatial mag deviation | Spatial sky 16325A emission deviations (filled: sky, open: star) | Spatial sky continuum emission | Spatial sky telluric CO2 absorption deviations (filled: H < 10) | |||||||||||||||||||||||
| 0 | 0 |
|
|
|
|
|
|
| IPAIR | NAME | SHIFT | NEWSHIFT | S/N | NAME | SHIFT | NEWSHIFT | S/N |
| 0 | 03770042 | 0.512474 | 0.00000 | 215.833 | 03770043 | 0.00466267 | 0.507811 | 219.108 |
| 1 | 03770038 | 0.507302 | 0.00517201 | 235.079 | 03770040 | 0.00338795 | 0.509086 | 239.315 |
| 2 | 03770041 | 0.511740 | 0.000733972 | 230.545 | 03770039 | 0.00108975 | 0.511384 | 238.757 |
| 3 | 03770037 | 0.506222 | 0.00625199 | 230.296 | 03770036 | 0.00000 | 0.512474 | 226.366 |