| Red | Green | Blue | |
| z | 17.64 | ||
| znorm | Inf | ||
| sky | -Inf | -Inf | -Inf |
| S/N | 31.8 | 54.3 | 58.6 |
| S/N(c) | 0.0 | 0.0 | 0.0 |
| SN(E/C) |
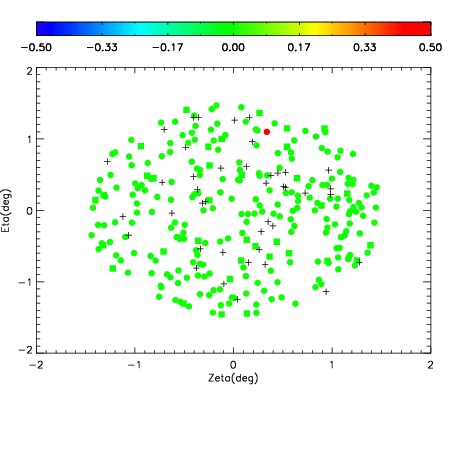
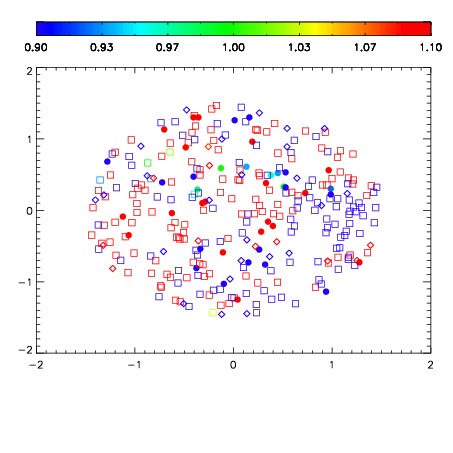
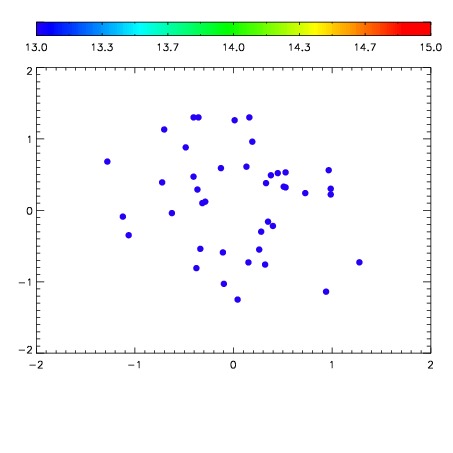

| Frame | Nreads | Zeropoints | Mag plots | Spatial mag deviation | Spatial sky 16325A emission deviations (filled: sky, open: star) | Spatial sky continuum emission | Spatial sky telluric CO2 absorption deviations (filled: H < 10) | |||||||||||||||||||||||
| 0 | 0 |
|
|
|
|
|
|
| IPAIR | NAME | SHIFT | NEWSHIFT | S/N | NAME | SHIFT | NEWSHIFT | S/N |
| 0 | 03700066 | 0.498584 | 0.00000 | 217.888 | 03700064 | 0.00136051 | 0.497223 | 215.190 |
| 1 | 03700062 | 0.495518 | 0.00306600 | 211.481 | 03700067 | 0.00100317 | 0.497581 | 214.839 |
| 2 | 03700061 | 0.493565 | 0.00501901 | 207.930 | 03700063 | 0.00219439 | 0.496390 | 212.752 |
| 3 | 03700065 | 0.497257 | 0.00132701 | 205.145 | 03700060 | 0.00000 | 0.498584 | 204.987 |