| Red | Green | Blue | |
| z | 17.64 | ||
| znorm | Inf | ||
| sky | -Inf | -Inf | -Inf |
| S/N | 24.0 | 43.6 | 46.4 |
| S/N(c) | 0.0 | 0.0 | 0.0 |
| SN(E/C) |
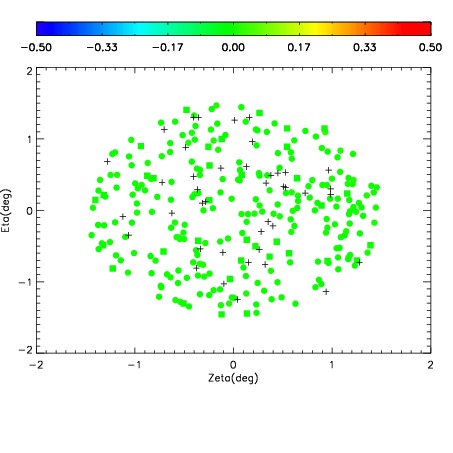
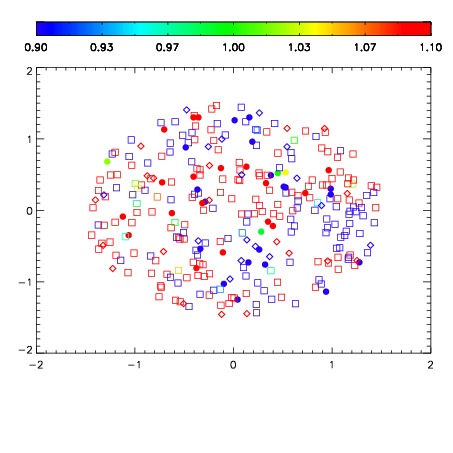
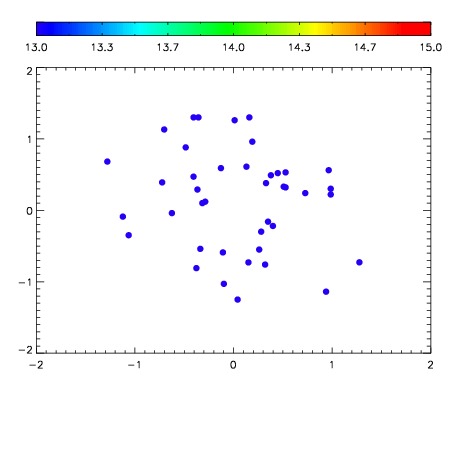

| Frame | Nreads | Zeropoints | Mag plots | Spatial mag deviation | Spatial sky 16325A emission deviations (filled: sky, open: star) | Spatial sky continuum emission | Spatial sky telluric CO2 absorption deviations (filled: H < 10) | |||||||||||||||||||||||
| 0 | 0 |
|
|
|
|
|
|
| IPAIR | NAME | SHIFT | NEWSHIFT | S/N | NAME | SHIFT | NEWSHIFT | S/N |
| 0 | 03970043 | 0.503381 | 0.00000 | 173.833 | 03970042 | 0.00325097 | 0.500130 | 181.166 |
| 1 | 03970044 | 0.502822 | 0.000559032 | 193.289 | 03970045 | 0.00146863 | 0.501912 | 193.245 |
| 2 | 03970039 | 0.500988 | 0.00239301 | 189.085 | 03970038 | 0.00000 | 0.503381 | 183.654 |
| 3 | 03970040 | 0.502708 | 0.000672996 | 148.498 | 03970041 | 0.00382586 | 0.499555 | 130.150 |