| Red | Green | Blue | |
| z | 17.64 | ||
| znorm | Inf | ||
| sky | -Inf | -Inf | -Inf |
| S/N | 30.3 | 52.1 | 54.2 |
| S/N(c) | 0.0 | 0.0 | 0.0 |
| SN(E/C) |
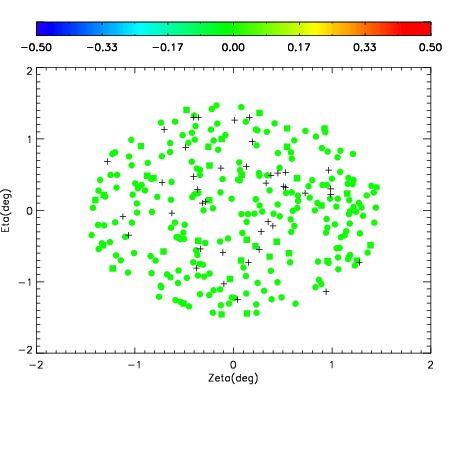
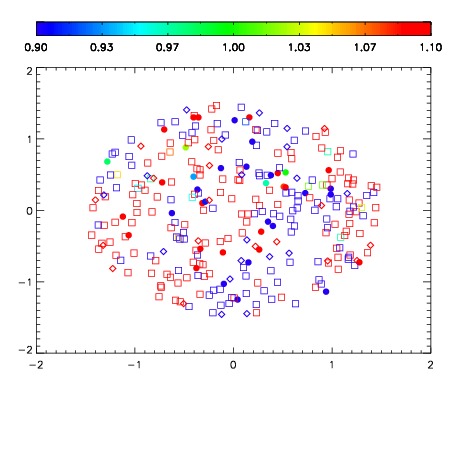
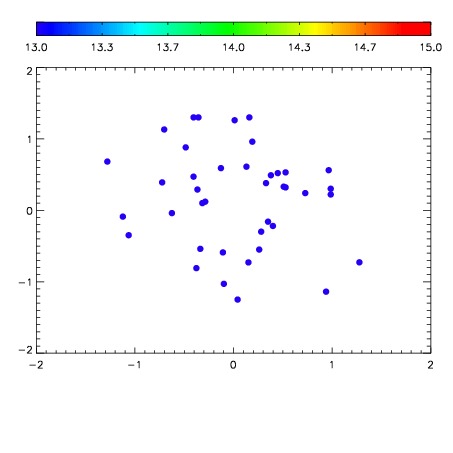

| Frame | Nreads | Zeropoints | Mag plots | Spatial mag deviation | Spatial sky 16325A emission deviations (filled: sky, open: star) | Spatial sky continuum emission | Spatial sky telluric CO2 absorption deviations (filled: H < 10) | |||||||||||||||||||||||
| 0 | 0 |
|
|
|
|
|
|
| IPAIR | NAME | SHIFT | NEWSHIFT | S/N | NAME | SHIFT | NEWSHIFT | S/N |
| 0 | 04570012 | 0.505476 | 0.00000 | 226.118 | 04570013 | 0.00190215 | 0.503574 | 224.129 |
| 1 | 04570011 | 0.503557 | 0.00191897 | 223.213 | 04570014 | 0.00122526 | 0.504251 | 223.313 |
| 2 | 04570015 | 0.503459 | 0.00201702 | 218.710 | 04570017 | 0.000815537 | 0.504660 | 219.637 |
| 3 | 04570016 | 0.504574 | 0.000901997 | 215.375 | 04570010 | 0.00000 | 0.505476 | 218.616 |