| Red | Green | Blue | |
| z | 17.64 | ||
| znorm | Inf | ||
| sky | -Inf | -Inf | -Inf |
| S/N | 31.4 | 49.8 | 57.3 |
| S/N(c) | 0.0 | 0.0 | 0.0 |
| SN(E/C) |
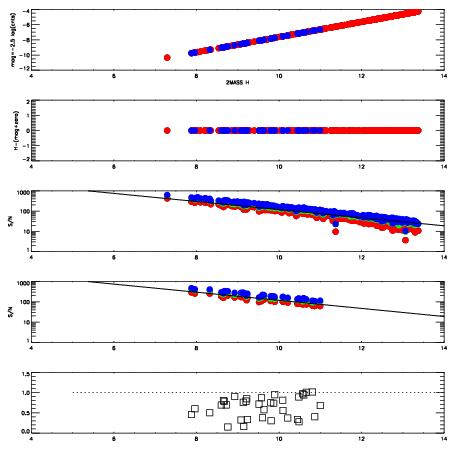

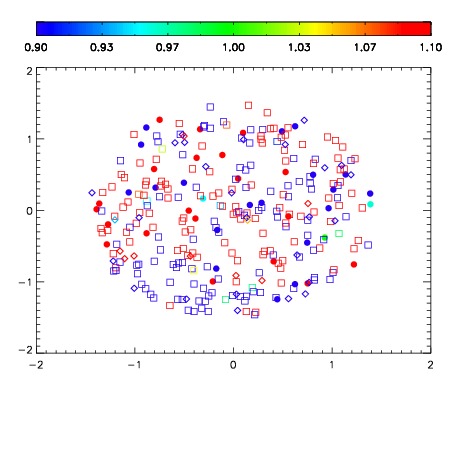
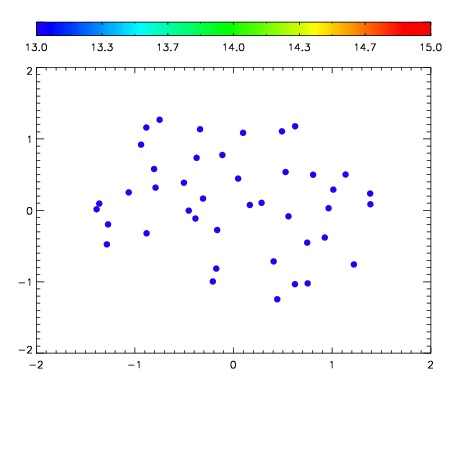

| Frame | Nreads | Zeropoints | Mag plots | Spatial mag deviation | Spatial sky 16325A emission deviations (filled: sky, open: star) | Spatial sky continuum emission | Spatial sky telluric CO2 absorption deviations (filled: H < 10) | |||||||||||||||||||||||
| 0 | 0 |
|
|
|
|
|
|
| IPAIR | NAME | SHIFT | NEWSHIFT | S/N | NAME | SHIFT | NEWSHIFT | S/N |
| 0 | 03420090 | 0.493848 | 0.00000 | 214.241 | 03420092 | -0.00217870 | 0.496027 | 218.293 |
| 1 | 03420086 | 0.493600 | 0.000247985 | 208.826 | 03420091 | 0.000505215 | 0.493343 | 215.197 |
| 2 | 03420085 | 0.493432 | 0.000416011 | 206.953 | 03420087 | -0.000204701 | 0.494053 | 208.796 |
| 3 | 03420089 | 0.492925 | 0.000923008 | 204.799 | 03420084 | 0.00000 | 0.493848 | 207.802 |