| Red | Green | Blue | |
| z | 17.64 | ||
| znorm | Inf | ||
| sky | -Inf | -Inf | -Inf |
| S/N | 31.9 | 53.1 | 61.6 |
| S/N(c) | 0.0 | 0.0 | 0.0 |
| SN(E/C) |
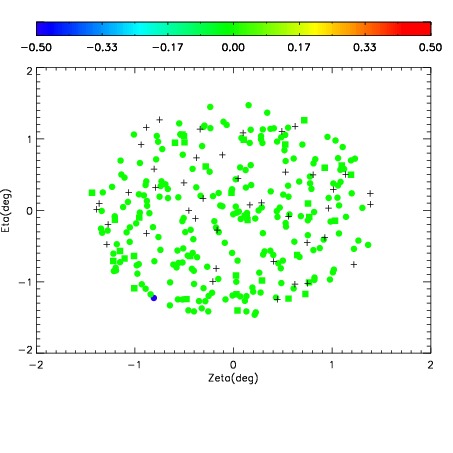
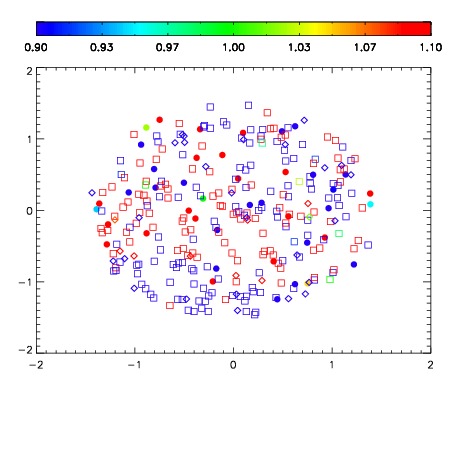
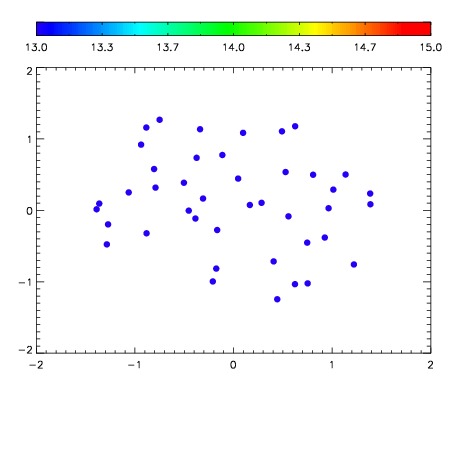

| Frame | Nreads | Zeropoints | Mag plots | Spatial mag deviation | Spatial sky 16325A emission deviations (filled: sky, open: star) | Spatial sky continuum emission | Spatial sky telluric CO2 absorption deviations (filled: H < 10) | |||||||||||||||||||||||
| 0 | 0 |
|
|
|
|
|
|
| IPAIR | NAME | SHIFT | NEWSHIFT | S/N | NAME | SHIFT | NEWSHIFT | S/N |
| 0 | 03430103 | 0.516812 | 0.00000 | 193.019 | 03430100 | 0.00119970 | 0.515612 | 200.857 |
| 1 | 03430099 | 0.514273 | 0.00253904 | 198.692 | 03430105 | 0.000833737 | 0.515978 | 202.206 |
| 2 | 03430106 | 0.511939 | 0.00487304 | 193.746 | 03430101 | -0.000345161 | 0.517157 | 201.001 |
| 3 | 03430098 | 0.510767 | 0.00604504 | 192.684 | 03430104 | 0.00160945 | 0.515203 | 199.987 |
| 4 | 03430102 | 0.512345 | 0.00446701 | 192.383 | 03430097 | 0.00000 | 0.516812 | 193.258 |