| Red | Green | Blue | |
| z | 17.64 | ||
| znorm | Inf | ||
| sky | -Inf | -Inf | -Inf |
| S/N | 29.2 | 49.5 | 53.2 |
| S/N(c) | 0.0 | 0.0 | 0.0 |
| SN(E/C) |

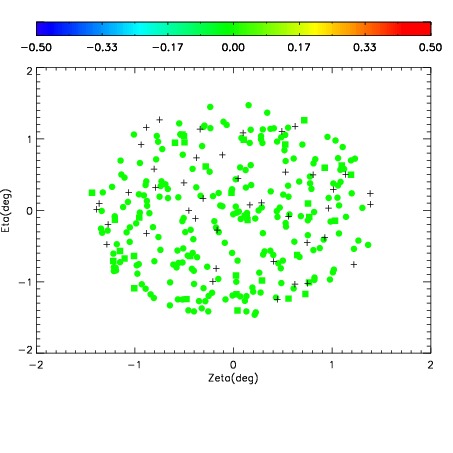
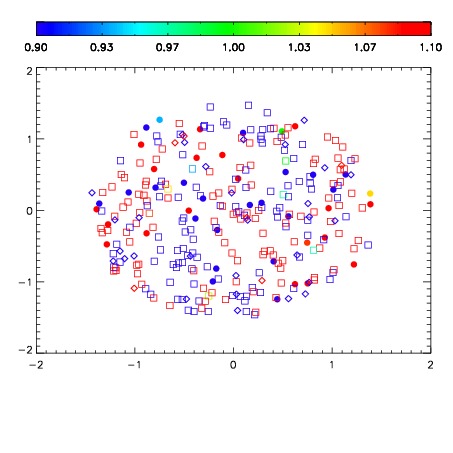
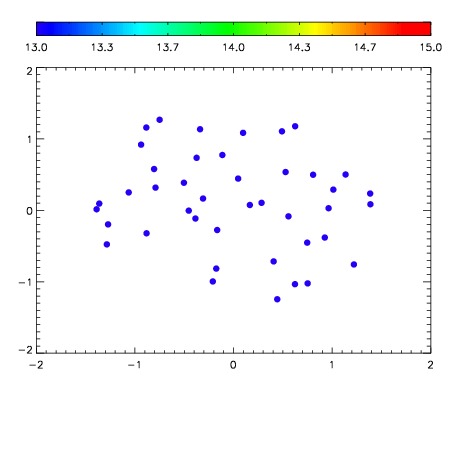

| Frame | Nreads | Zeropoints | Mag plots | Spatial mag deviation | Spatial sky 16325A emission deviations (filled: sky, open: star) | Spatial sky continuum emission | Spatial sky telluric CO2 absorption deviations (filled: H < 10) | |||||||||||||||||||||||
| 0 | 0 |
|
|
|
|
|
|
| IPAIR | NAME | SHIFT | NEWSHIFT | S/N | NAME | SHIFT | NEWSHIFT | S/N |
| 0 | 03700088 | 0.512787 | 0.00000 | 192.314 | 03700086 | -4.99714e-05 | 0.512837 | 191.497 |
| 1 | 03700087 | 0.504926 | 0.00786096 | 194.651 | 03700089 | -0.00100730 | 0.513794 | 197.778 |
| 2 | 03700084 | 0.510353 | 0.00243396 | 187.810 | 03700085 | 0.00186554 | 0.510921 | 191.209 |
| 3 | 03700083 | 0.506633 | 0.00615400 | 184.727 | 03700082 | 0.00000 | 0.512787 | 184.481 |