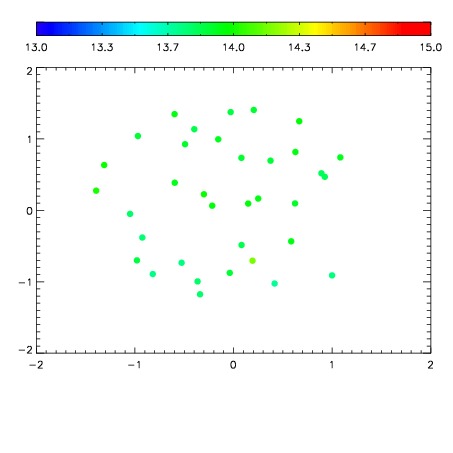
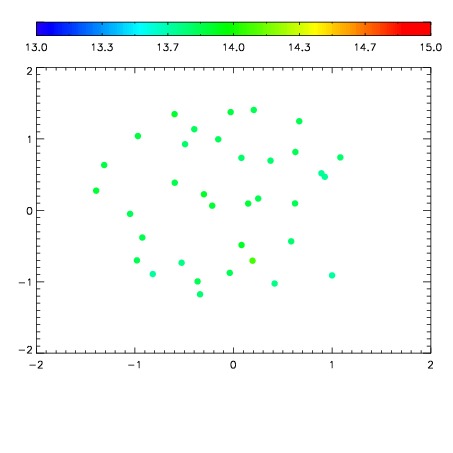
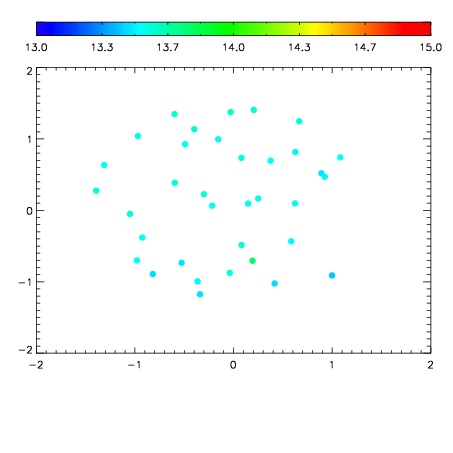
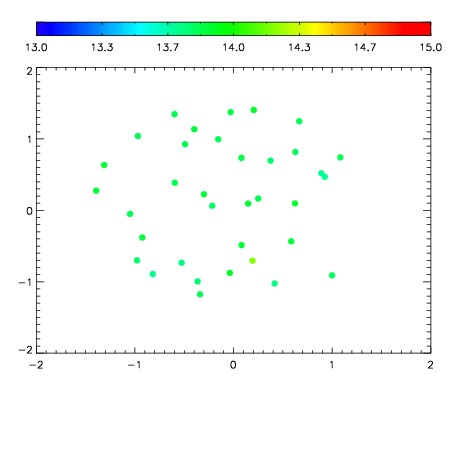
| Frame | Nreads | Zeropoints | Mag plots
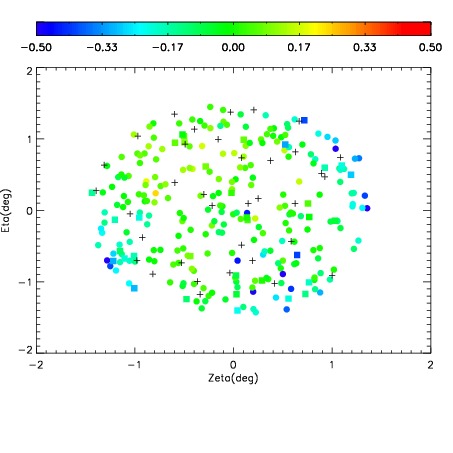
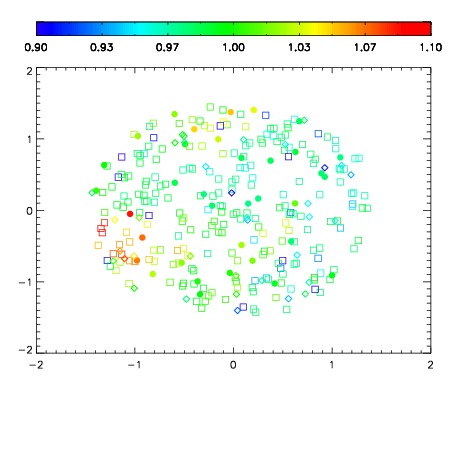
| Spatial mag deviation
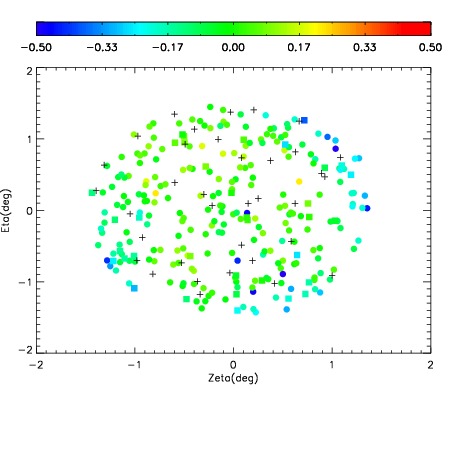
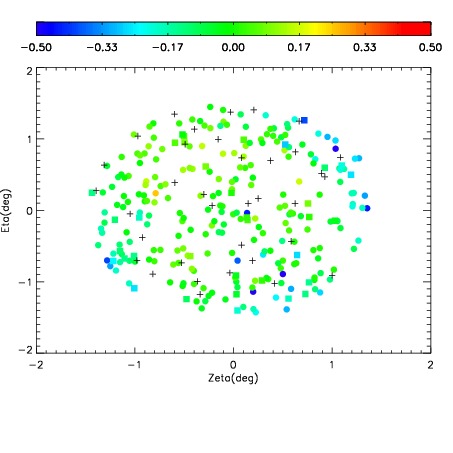
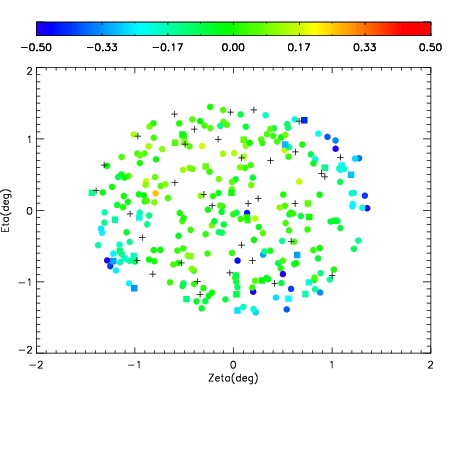
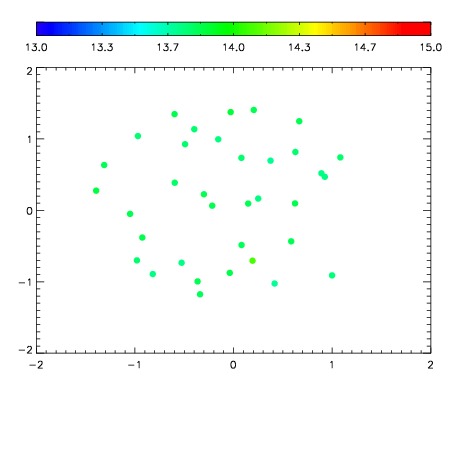
| Spatial sky 16325A emission deviations (filled: sky, open: star)
| Spatial sky continuum emission
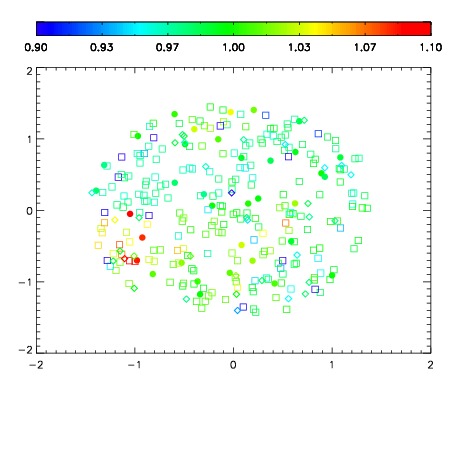
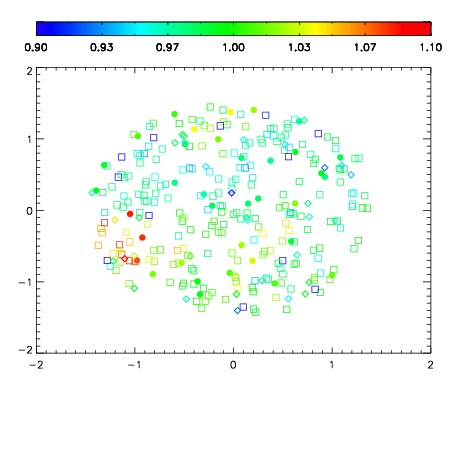
| Spatial sky telluric CO2 absorption deviations (filled: H < 10)
|
| 3760077
| 47
| | Red | Green | Blue
| | z | | 18.45
| | znorm | | 14.27
| | sky | 14.2 | 13.9 | 13.9
| | S/N | 9.3 | 16.4 | 19.6
| | S/N(c) | 8.0 | 15.4 | 18.7
| | SN(E/C) 0.77
|
| 
| 
| 
| 
| 
|
| 3760078
| 47
| | Red | Green | Blue
| | z | | 18.56
| | znorm | | 14.38
| | sky | 14.2 | 13.9 | 14.2
| | S/N | 10.3 | 17.8 | 20.9
| | S/N(c) | 9.0 | 16.6 | 19.6
| | SN(E/C) 0.76
|
| 
| 
| 
| 
| 
|
| 3760079
| 47
| | Red | Green | Blue
| | z | | 18.63
| | znorm | | 14.45
| | sky | 14.0 | 13.8 | 13.9
| | S/N | 10.6 | 18.6 | 21.8
| | S/N(c) | 9.3 | 17.3 | 20.4
| | SN(E/C) 0.75
|
| 
| 
| 
| 
| 
|
| 3760080
| 47
| | Red | Green | Blue
| | z | | 18.51
| | znorm | | 14.33
| | sky | 13.7 | 13.6 | 13.7
| | S/N | 9.7 | 16.9 | 19.9
| | S/N(c) | 8.2 | 15.6 | 18.5
| | SN(E/C) 0.77
|
| 
| 
| 
| 
| 
|
| 3760081
| 47
| | Red | Green | Blue
| | z | | 18.59
| | znorm | | 14.41
| | sky | 13.9 | 13.7 | 14.0
| | S/N | 10.4 | 18.0 | 21.1
| | S/N(c) | 9.1 | 16.8 | 19.8
| | SN(E/C) 0.74
|
| 
| 
| 
| 
| 
|
| 3760082
| 47
| | Red | Green | Blue
| | z | | 18.68
| | znorm | | 14.50
| | sky | 14.1 | 13.8 | 14.0
| | S/N | 11.1 | 19.3 | 21.4
| | S/N(c) | 9.6 | 17.8 | 20.3
| | SN(E/C) 0.75
|
| 
| 
| 
| 
| 
|
| 3760083
| 47
| | Red | Green | Blue
| | z | | 18.66
| | znorm | | 14.48
| | sky | 13.8 | 13.7 | 13.8
| | S/N | 10.8 | 18.9 | 21.2
| | S/N(c) | 9.3 | 17.4 | 20.3
| | SN(E/C) 0.72
|
| 
| 
| 
| 
| 
|
| 3760084
| 47
| | Red | Green | Blue
| | z | | 18.72
| | znorm | | 14.54
| | sky | 14.0 | 13.8 | 14.0
| | S/N | 11.4 | 19.8 | 21.9
| | S/N(c) | 9.8 | 18.3 | 20.8
| | SN(E/C) 0.77
|
| 
| 
| 
| 
| 
|