| Red | Green | Blue | |
| z | 17.64 | ||
| znorm | Inf | ||
| sky | -Inf | -Inf | -Inf |
| S/N | 18.2 | 33.8 | 39.7 |
| S/N(c) | 0.0 | 0.0 | 0.0 |
| SN(E/C) |
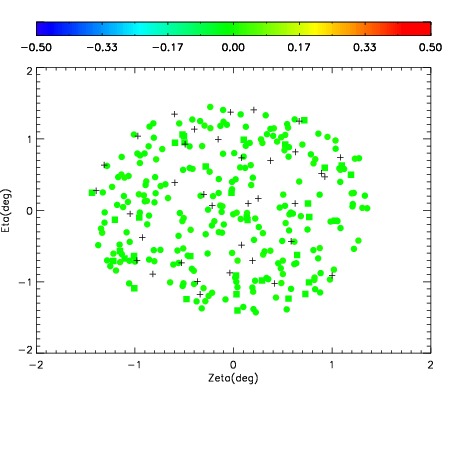
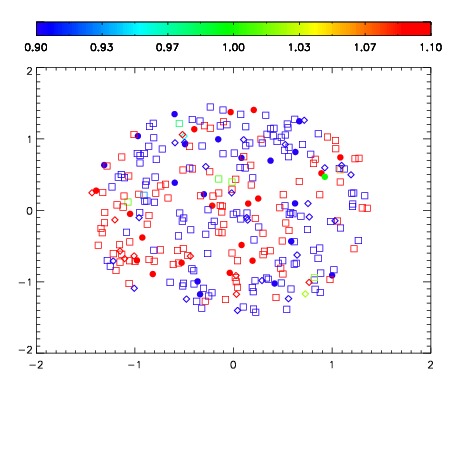
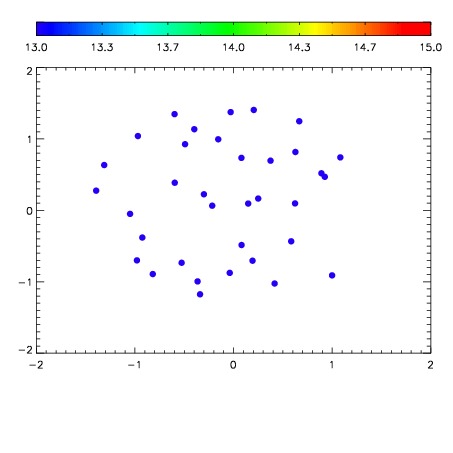

| Frame | Nreads | Zeropoints | Mag plots | Spatial mag deviation | Spatial sky 16325A emission deviations (filled: sky, open: star) | Spatial sky continuum emission | Spatial sky telluric CO2 absorption deviations (filled: H < 10) | |||||||||||||||||||||||
| 0 | 0 |
|
|
|
|
|
|
| IPAIR | NAME | SHIFT | NEWSHIFT | S/N | NAME | SHIFT | NEWSHIFT | S/N |
| 0 | 03760083 | 0.513019 | 0.00000 | 145.886 | 03760080 | 0.000403442 | 0.512616 | 135.769 |
| 1 | 03760082 | 0.510245 | 0.00277400 | 148.557 | 03760084 | 0.000746686 | 0.512272 | 149.934 |
| 2 | 03760079 | 0.509858 | 0.00316101 | 148.166 | 03760081 | -0.000722056 | 0.513741 | 145.850 |
| 3 | 03760078 | 0.509319 | 0.00370002 | 147.982 | 03760077 | 0.00000 | 0.513019 | 139.126 |