| Red | Green | Blue | |
| z | 17.64 | ||
| znorm | Inf | ||
| sky | -Inf | -Inf | -Inf |
| S/N | 21.8 | 35.7 | 44.0 |
| S/N(c) | 0.0 | 0.0 | 0.0 |
| SN(E/C) |
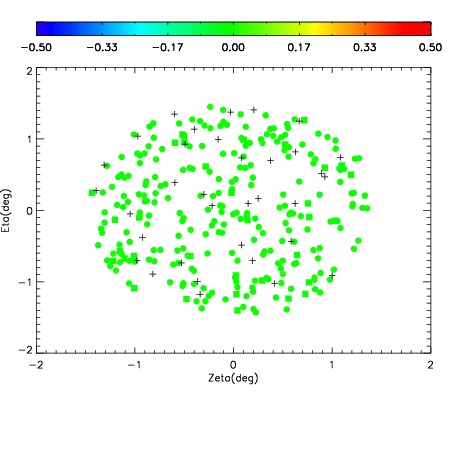
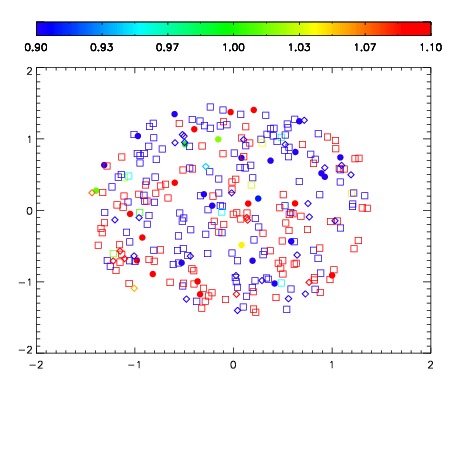
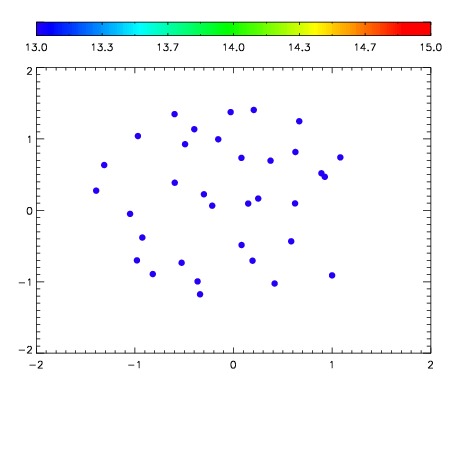

| Frame | Nreads | Zeropoints | Mag plots | Spatial mag deviation | Spatial sky 16325A emission deviations (filled: sky, open: star) | Spatial sky continuum emission | Spatial sky telluric CO2 absorption deviations (filled: H < 10) | |||||||||||||||||||||||
| 0 | 0 |
|
|
|
|
|
|
| IPAIR | NAME | SHIFT | NEWSHIFT | S/N | NAME | SHIFT | NEWSHIFT | S/N |
| 0 | 04600031 | 0.498138 | 0.00000 | 123.536 | 04600032 | 0.00489641 | 0.493242 | 118.537 |
| 1 | 04600026 | 0.495405 | 0.00273302 | 149.161 | 04600025 | 0.00000 | 0.498138 | 139.424 |
| 2 | 04600027 | 0.496342 | 0.00179601 | 148.365 | 04600028 | 0.00260875 | 0.495529 | 135.672 |
| 3 | 04600030 | 0.496335 | 0.00180301 | 112.089 | 04600029 | 0.00505293 | 0.493085 | 112.515 |