| Red | Green | Blue | |
| z | 17.64 | ||
| znorm | Inf | ||
| sky | -NaN | -NaN | -Inf |
| S/N | 24.2 | 44.3 | 47.4 |
| S/N(c) | 0.0 | 0.0 | 0.0 |
| SN(E/C) |
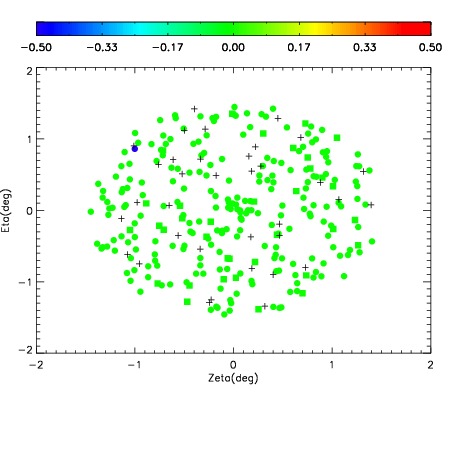
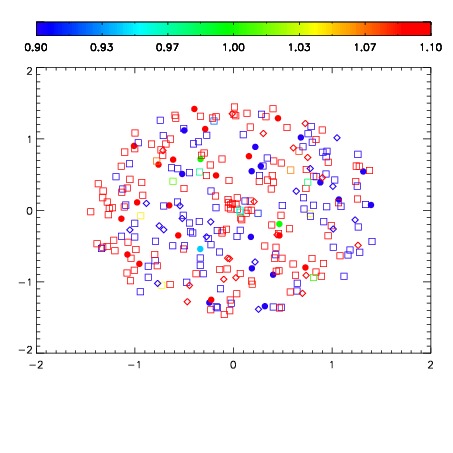
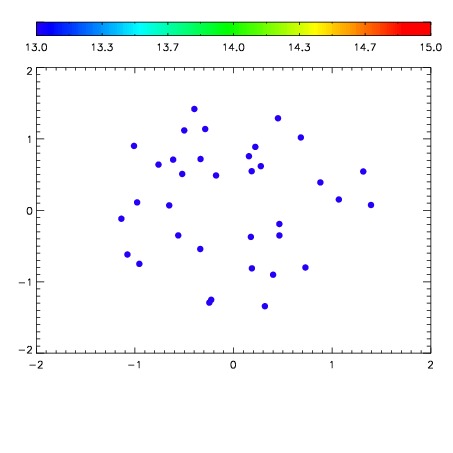

| Frame | Nreads | Zeropoints | Mag plots | Spatial mag deviation | Spatial sky 16325A emission deviations (filled: sky, open: star) | Spatial sky continuum emission | Spatial sky telluric CO2 absorption deviations (filled: H < 10) | |||||||||||||||||||||||
| 0 | 0 |
|
|
|
|
|
|
| IPAIR | NAME | SHIFT | NEWSHIFT | S/N | NAME | SHIFT | NEWSHIFT | S/N |
| 0 | 03100100 | 0.495816 | 0.00000 | 222.664 | 03100102 | 0.000421917 | 0.495394 | 229.921 |
| 1 | 03100099 | 0.495015 | 0.000800997 | 221.316 | 03100101 | 0.00129679 | 0.494519 | 228.191 |
| 2 | 03100103 | 0.495277 | 0.000539005 | 218.780 | 03100098 | 0.00000 | 0.495816 | 216.761 |