| Red | Green | Blue | |
| z | 17.64 | ||
| znorm | Inf | ||
| sky | -Inf | -NaN | -Inf |
| S/N | 31.5 | 55.3 | 60.3 |
| S/N(c) | 0.0 | 0.0 | 0.0 |
| SN(E/C) |

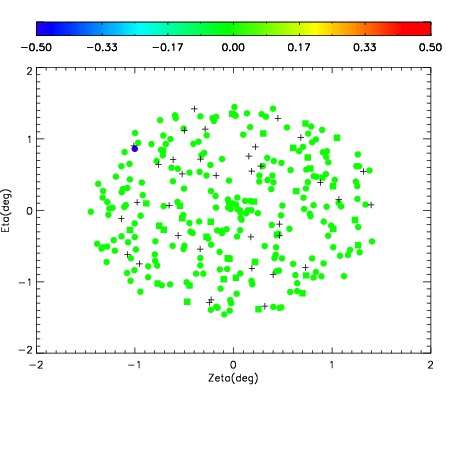
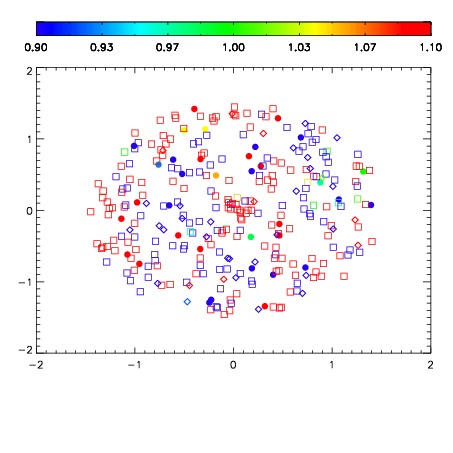
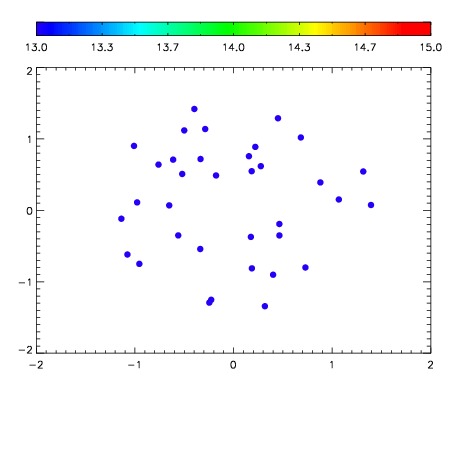

| Frame | Nreads | Zeropoints | Mag plots | Spatial mag deviation | Spatial sky 16325A emission deviations (filled: sky, open: star) | Spatial sky continuum emission | Spatial sky telluric CO2 absorption deviations (filled: H < 10) | |||||||||||||||||||||||
| 0 | 0 |
|
|
|
|
|
|
| IPAIR | NAME | SHIFT | NEWSHIFT | S/N | NAME | SHIFT | NEWSHIFT | S/N |
| 0 | 03420071 | 0.504374 | 0.00000 | 232.096 | 03420072 | 0.00301924 | 0.501355 | 230.860 |
| 1 | 03420074 | 0.501933 | 0.00244105 | 239.993 | 03420076 | 0.00639828 | 0.497976 | 237.957 |
| 2 | 03420075 | 0.503722 | 0.000652015 | 237.821 | 03420073 | 0.00397150 | 0.500403 | 237.718 |
| 3 | 03420070 | 0.501357 | 0.00301701 | 229.638 | 03420069 | 0.00000 | 0.504374 | 227.328 |