| Red | Green | Blue | |
| z | 17.64 | ||
| znorm | Inf | ||
| sky | -Inf | -NaN | -Inf |
| S/N | 37.6 | 68.0 | 73.3 |
| S/N(c) | 0.0 | 0.0 | 0.0 |
| SN(E/C) |
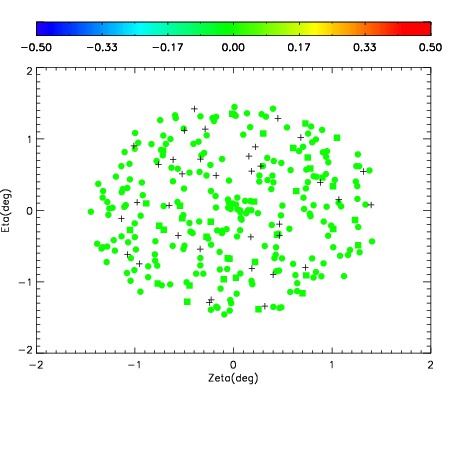
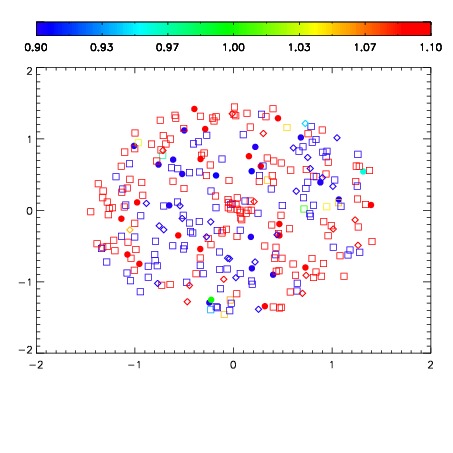
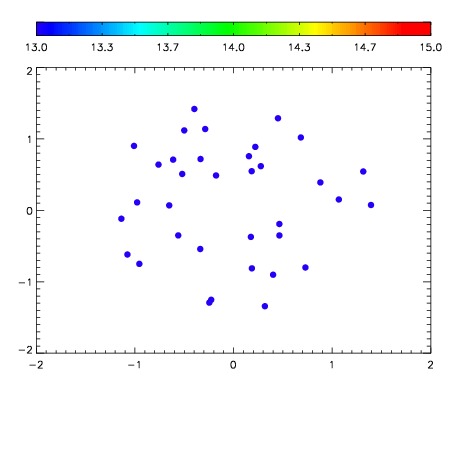

| Frame | Nreads | Zeropoints | Mag plots | Spatial mag deviation | Spatial sky 16325A emission deviations (filled: sky, open: star) | Spatial sky continuum emission | Spatial sky telluric CO2 absorption deviations (filled: H < 10) | |||||||||||||||||||||||
| 0 | 0 |
|
|
|
|
|
|
| IPAIR | NAME | SHIFT | NEWSHIFT | S/N | NAME | SHIFT | NEWSHIFT | S/N |
| 0 | 03430088 | 0.513455 | 0.00000 | 199.033 | 03430089 | 0.00120194 | 0.512253 | 203.948 |
| 1 | 03430091 | 0.508115 | 0.00533998 | 221.188 | 03430085 | 0.00254414 | 0.510911 | 216.428 |
| 2 | 03430092 | 0.511696 | 0.00175899 | 220.586 | 03430086 | 0.000967238 | 0.512488 | 214.762 |
| 3 | 03430084 | 0.510863 | 0.00259197 | 217.032 | 03430090 | -0.000513434 | 0.513968 | 212.776 |
| 4 | 03430083 | 0.509929 | 0.00352597 | 210.662 | 03430093 | 0.000354077 | 0.513101 | 211.261 |
| 5 | 03430087 | 0.509109 | 0.00434595 | 202.725 | 03430082 | -0.000656720 | 0.514112 | 205.748 |
| 6 | 03430080 | 0.507399 | 0.00605595 | 192.337 | 03430081 | 0.00124119 | 0.512214 | 193.014 |
| 7 | 03430079 | 0.505171 | 0.00828397 | 181.112 | 03430078 | 0.00000 | 0.513455 | 164.900 |