| Red | Green | Blue | |
| z | 17.64 | ||
| znorm | Inf | ||
| sky | -Inf | -Inf | -Inf |
| S/N | 23.4 | 43.3 | 46.1 |
| S/N(c) | 0.0 | 0.0 | 0.0 |
| SN(E/C) |
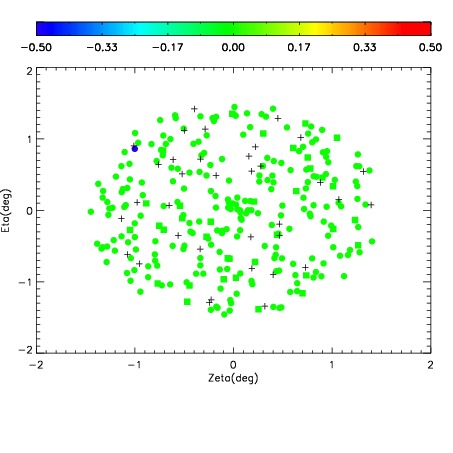
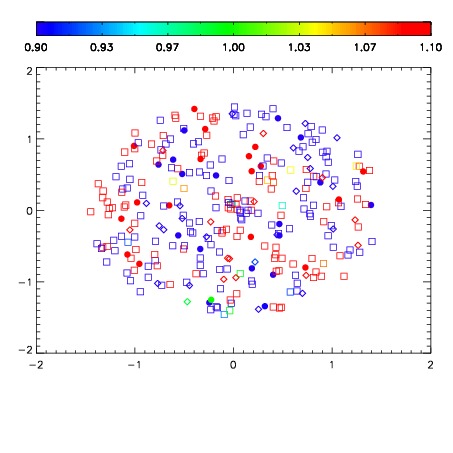
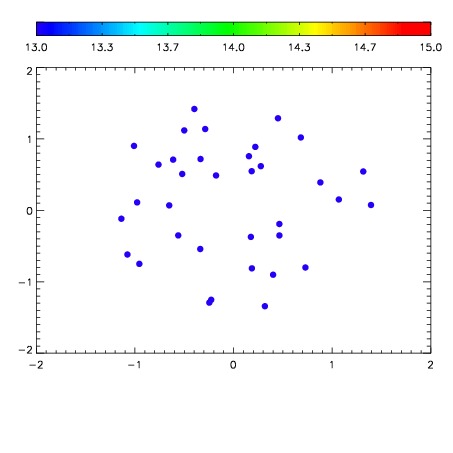

| Frame | Nreads | Zeropoints | Mag plots | Spatial mag deviation | Spatial sky 16325A emission deviations (filled: sky, open: star) | Spatial sky continuum emission | Spatial sky telluric CO2 absorption deviations (filled: H < 10) | |||||||||||||||||||||||
| 0 | 0 |
|
|
|
|
|
|
| IPAIR | NAME | SHIFT | NEWSHIFT | S/N | NAME | SHIFT | NEWSHIFT | S/N |
| 0 | 03490012 | 0.507209 | 0.00000 | 189.224 | 03490017 | 0.00252261 | 0.504686 | 198.956 |
| 1 | 03490016 | 0.506419 | 0.000790000 | 214.934 | 03490014 | 0.000628548 | 0.506580 | 204.659 |
| 2 | 03490015 | 0.505513 | 0.00169599 | 212.724 | 03490013 | 7.18007e-05 | 0.507137 | 199.379 |
| 3 | 03490011 | 0.505574 | 0.00163502 | 180.619 | 03490010 | 0.00000 | 0.507209 | 182.629 |