| Frame | Nreads | Zeropoints | Mag plots
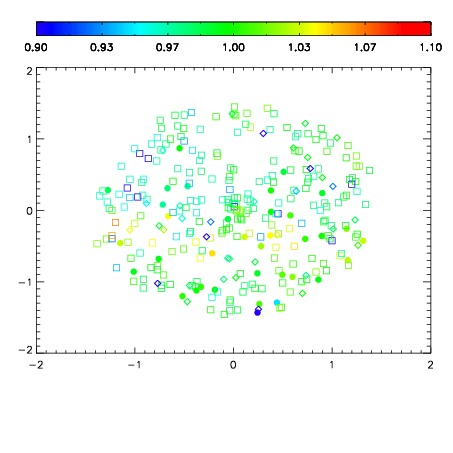
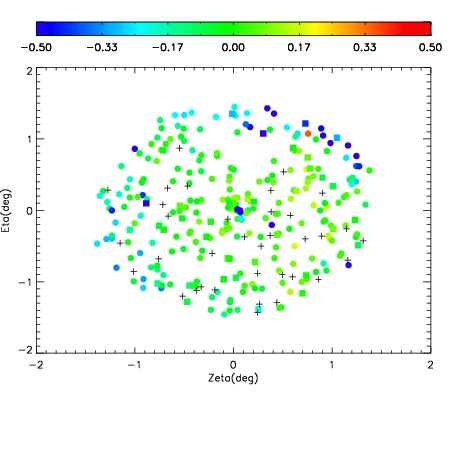
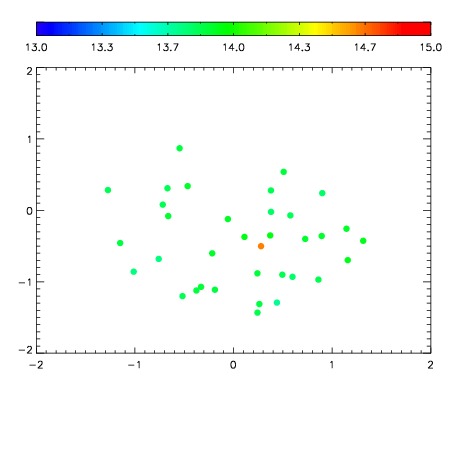
| Spatial mag deviation
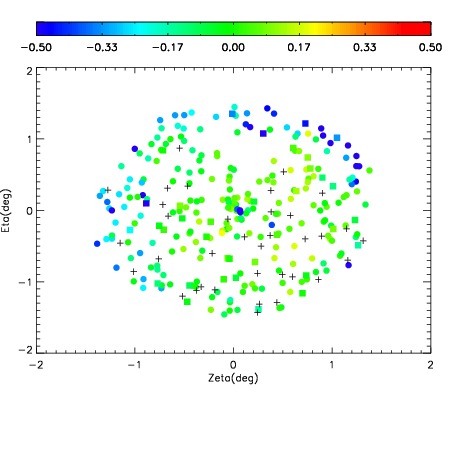
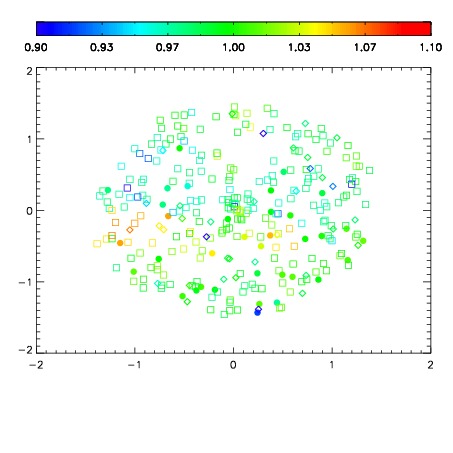
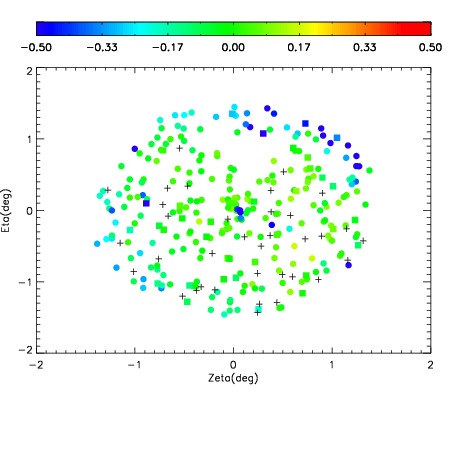
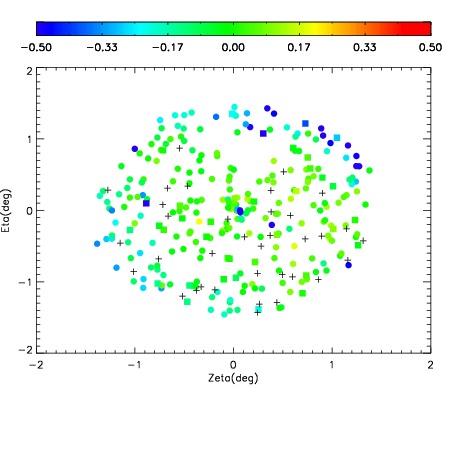
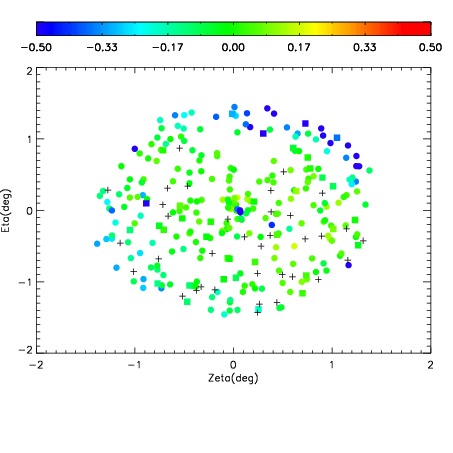
| Spatial sky 16325A emission deviations (filled: sky, open: star)
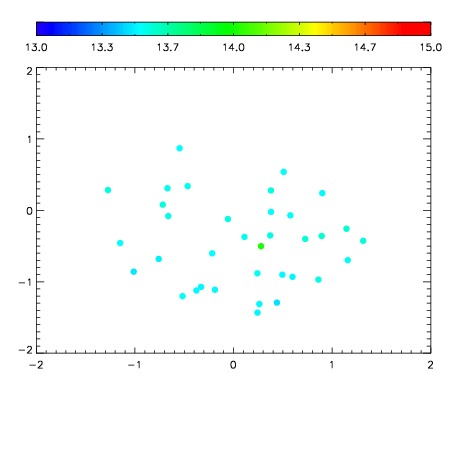
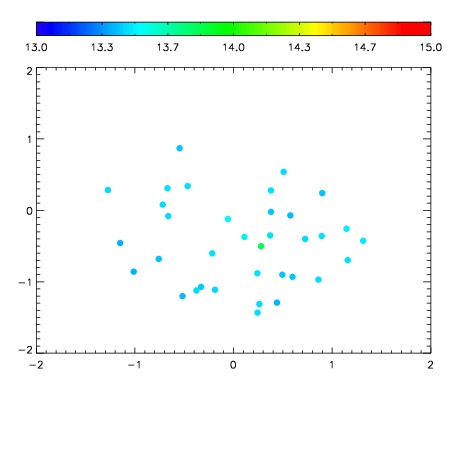
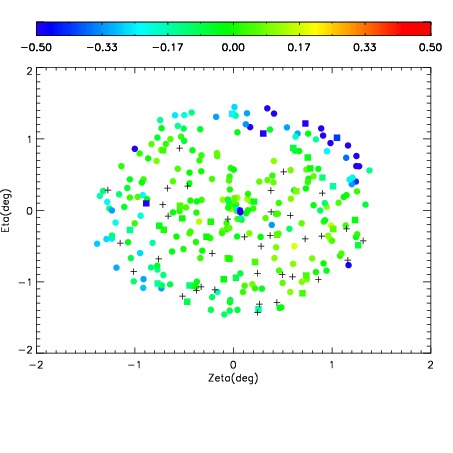
| Spatial sky continuum emission
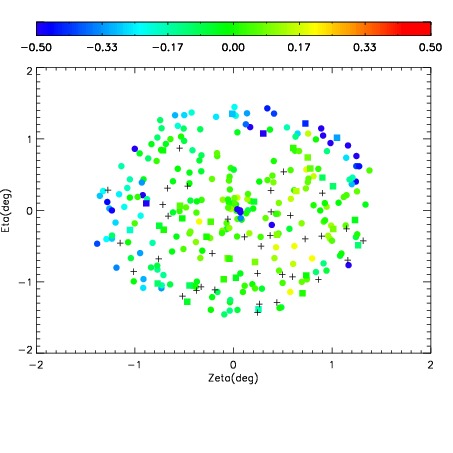
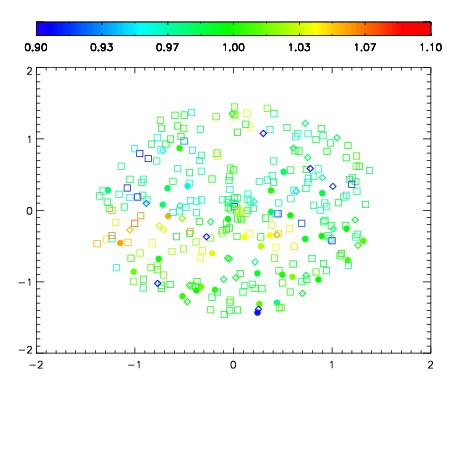
| Spatial sky telluric CO2 absorption deviations (filled: H < 10)
|
| 3140095
| 47
| | Red | Green | Blue
| | z | | 17.86
| | znorm | | 13.68
| | sky | 13.6 | 13.5 | 13.5
| | S/N | 5.8 | 11.3 | 11.6
| | S/N(c) | 5.0 | 10.4 | 11.5
| | SN(E/C) 0.92
|
| 
| 
| 
| 
| 
|
| 3140096
| 47
| | Red | Green | Blue
| | z | | 17.63
| | znorm | | 13.45
| | sky | 13.6 | 13.5 | 13.7
| | S/N | 4.9 | 9.1 | 10.5
| | S/N(c) | 4.3 | 8.3 | 10.1
| | SN(E/C) 0.96
|
| 
| 
| 
| 
| 
|
| 3140097
| 47
| | Red | Green | Blue
| | z | | 17.40
| | znorm | | 13.22
| | sky | 13.5 | 13.5 | 13.6
| | S/N | 4.0 | 7.7 | 8.5
| | S/N(c) | 3.5 | 7.0 | 8.2
| | SN(E/C) 0.94
|
| 
| 
| 
| 
| 
|
| 3140098
| 47
| | Red | Green | Blue
| | z | | 17.41
| | znorm | | 13.23
| | sky | 13.5 | 13.5 | 13.6
| | S/N | 4.2 | 8.0 | 8.5
| | S/N(c) | 3.7 | 7.2 | 8.2
| | SN(E/C) 0.97
|
| 
| 
| 
| 
| 
|
| 3140099
| 47
| | Red | Green | Blue
| | z | | 17.92
| | znorm | | 13.74
| | sky | 13.7 | 13.6 | 13.8
| | S/N | 6.2 | 11.6 | 12.6
| | S/N(c) | 5.4 | 10.5 | 11.8
| | SN(E/C) 0.96
|
| 
| 
| 
| 
| 
|
| 3140100
| 47
| | Red | Green | Blue
| | z | | 17.71
| | znorm | | 13.53
| | sky | 13.6 | 13.6 | 13.7
| | S/N | 5.3 | 10.1 | 10.9
| | S/N(c) | 4.7 | 9.4 | 10.2
| | SN(E/C) 0.92
|
| 
| 
| 
| 
| 
|
| 3140101
| 47
| | Red | Green | Blue
| | z | | 17.85
| | znorm | | 13.67
| | sky | 13.7 | 13.7 | 13.8
| | S/N | 6.0 | 11.7 | 12.2
| | S/N(c) | 5.3 | 10.7 | 11.5
| | SN(E/C) 0.93
|
| 
| 
| 
| 
| 
|
| 3140102
| 47
| | Red | Green | Blue
| | z | | 18.20
| | znorm | | 14.02
| | sky | 13.9 | 13.9 | 13.9
| | S/N | 7.8 | 14.9 | 15.1
| | S/N(c) | 7.0 | 13.6 | 14.6
| | SN(E/C) 0.89
|
| 
| 
| 
| 
| 
|