| Red | Green | Blue | |
| z | 17.64 | ||
| znorm | Inf | ||
| sky | -Inf | -Inf | -Inf |
| S/N | 9.7 | 19.0 | 21.7 |
| S/N(c) | 0.0 | 0.0 | 0.0 |
| SN(E/C) |
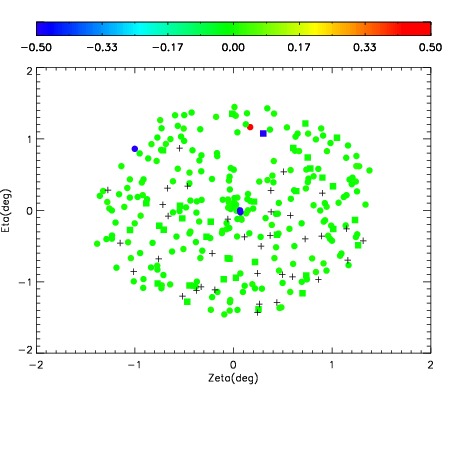
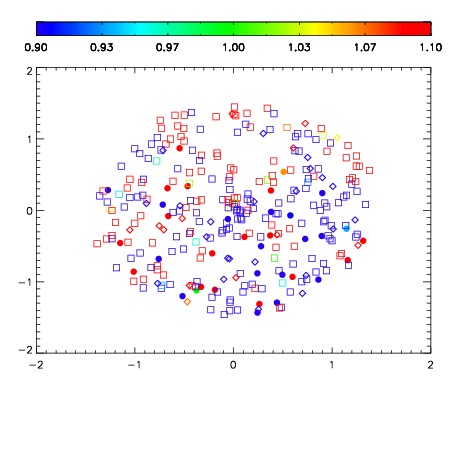
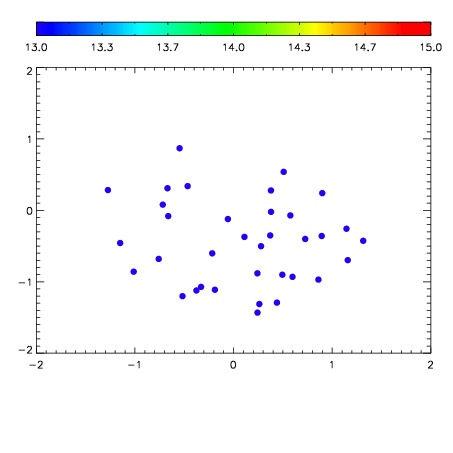

| Frame | Nreads | Zeropoints | Mag plots | Spatial mag deviation | Spatial sky 16325A emission deviations (filled: sky, open: star) | Spatial sky continuum emission | Spatial sky telluric CO2 absorption deviations (filled: H < 10) | |||||||||||||||||||||||
| 0 | 0 |
|
|
|
|
|
|
| IPAIR | NAME | SHIFT | NEWSHIFT | S/N | NAME | SHIFT | NEWSHIFT | S/N |
| 0 | 03140097 | 0.507942 | 0.00000 | 76.6915 | 03140098 | 0.00215665 | 0.505785 | 77.0574 |
| 1 | 03140101 | 0.503187 | 0.00475502 | 97.1705 | 03140102 | -0.00146093 | 0.509403 | 114.484 |
| 2 | 03140100 | 0.499715 | 0.00822702 | 90.0808 | 03140099 | -0.00283108 | 0.510773 | 100.077 |
| 3 | 03140096 | 0.507068 | 0.000874043 | 86.1835 | 03140095 | 0.00000 | 0.507942 | 95.4831 |