| Red | Green | Blue | |
| z | 17.64 | ||
| znorm | Inf | ||
| sky | -Inf | -Inf | -Inf |
| S/N | 30.0 | 52.8 | 56.1 |
| S/N(c) | 0.0 | 0.0 | 0.0 |
| SN(E/C) |
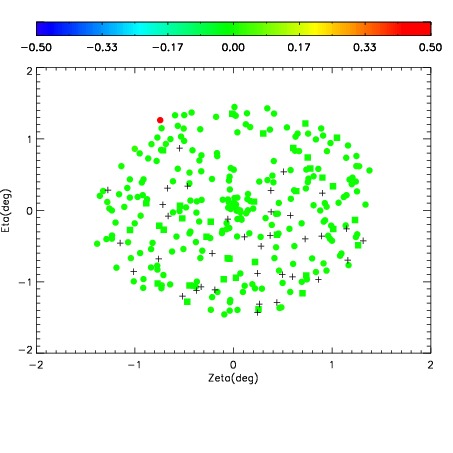
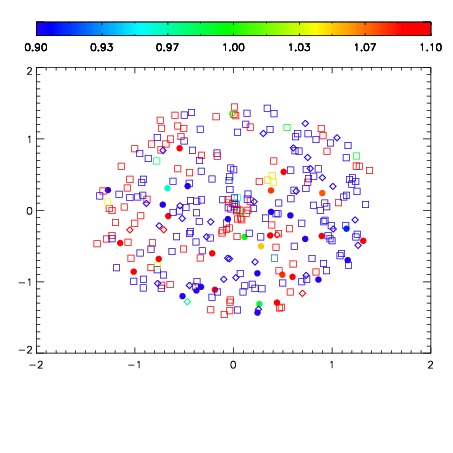
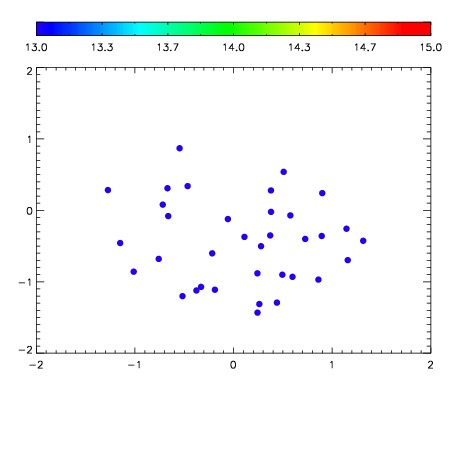

| Frame | Nreads | Zeropoints | Mag plots | Spatial mag deviation | Spatial sky 16325A emission deviations (filled: sky, open: star) | Spatial sky continuum emission | Spatial sky telluric CO2 absorption deviations (filled: H < 10) | |||||||||||||||||||||||
| 0 | 0 |
|
|
|
|
|
|
| IPAIR | NAME | SHIFT | NEWSHIFT | S/N | NAME | SHIFT | NEWSHIFT | S/N |
| 0 | 03660063 | 0.498694 | 0.00000 | 185.196 | 03660068 | 0.00175633 | 0.496938 | 173.294 |
| 1 | 03660062 | 0.496486 | 0.00220799 | 184.587 | 03660064 | 0.00186357 | 0.496830 | 171.084 |
| 2 | 03660067 | 0.498396 | 0.000297993 | 177.198 | 03660065 | 0.000949867 | 0.497744 | 169.999 |
| 3 | 03660066 | 0.496405 | 0.00228900 | 174.429 | 03660061 | 0.00000 | 0.498694 | 166.165 |