| Red | Green | Blue | |
| z | 17.64 | ||
| znorm | Inf | ||
| sky | -NaN | -NaN | -Inf |
| S/N | 20.6 | 39.1 | 41.3 |
| S/N(c) | 0.0 | 0.0 | 0.0 |
| SN(E/C) |
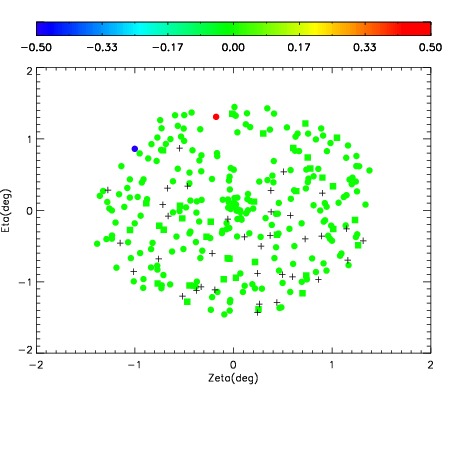
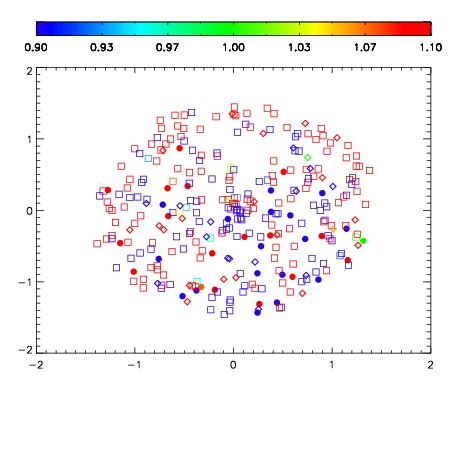
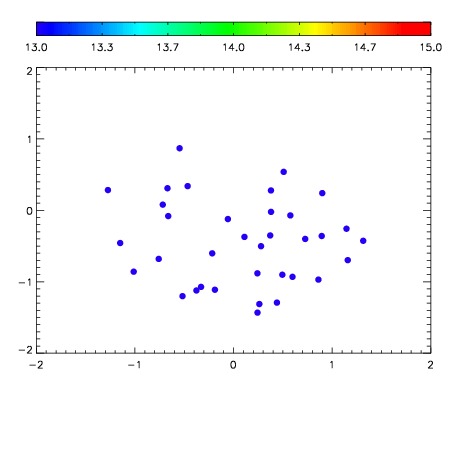

| Frame | Nreads | Zeropoints | Mag plots | Spatial mag deviation | Spatial sky 16325A emission deviations (filled: sky, open: star) | Spatial sky continuum emission | Spatial sky telluric CO2 absorption deviations (filled: H < 10) | |||||||||||||||||||||||
| 0 | 0 |
|
|
|
|
|
|
| IPAIR | NAME | SHIFT | NEWSHIFT | S/N | NAME | SHIFT | NEWSHIFT | S/N |
| 0 | 03760068 | 0.512531 | 0.00000 | 141.171 | 03760069 | 0.000912263 | 0.511619 | 148.961 |
| 1 | 03760067 | 0.512211 | 0.000319958 | 136.863 | 03760073 | -0.000285850 | 0.512817 | 131.144 |
| 2 | 03760072 | 0.511613 | 0.000917971 | 132.894 | 03760066 | 0.00111434 | 0.511417 | 129.876 |
| 3 | 03760071 | 0.510969 | 0.00156200 | 129.220 | 03760065 | 0.000537209 | 0.511994 | 127.986 |
| 4 | 03760063 | 0.509866 | 0.00266498 | 119.583 | 03760062 | 0.00000 | 0.512531 | 123.582 |
| 5 | 03760064 | 0.510826 | 0.00170499 | 96.8006 | 03760070 | -0.000145549 | 0.512677 | 108.367 |