| Red | Green | Blue | |
| z | 17.64 | ||
| znorm | Inf | ||
| sky | -Inf | -Inf | -Inf |
| S/N | 17.9 | 33.4 | 35.4 |
| S/N(c) | 0.0 | 0.0 | 0.0 |
| SN(E/C) |
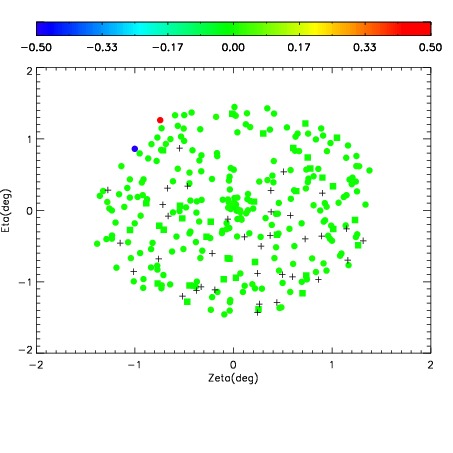
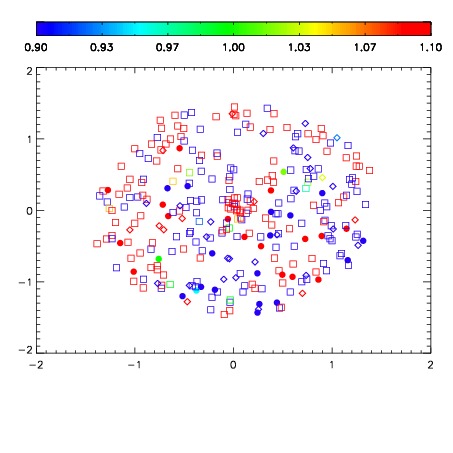
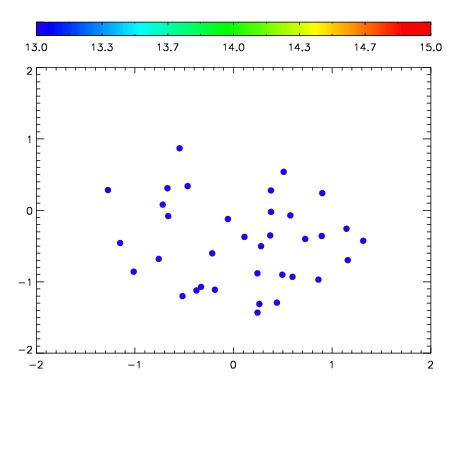

| Frame | Nreads | Zeropoints | Mag plots | Spatial mag deviation | Spatial sky 16325A emission deviations (filled: sky, open: star) | Spatial sky continuum emission | Spatial sky telluric CO2 absorption deviations (filled: H < 10) | |||||||||||||||||||||||
| 0 | 0 |
|
|
|
|
|
|
| IPAIR | NAME | SHIFT | NEWSHIFT | S/N | NAME | SHIFT | NEWSHIFT | S/N |
| 0 | 03960041 | 0.489241 | 0.00000 | 45.4779 | 03960042 | 0.000471316 | 0.488770 | 77.2400 |
| 1 | 03960044 | 0.487587 | 0.00165400 | 173.883 | 03960046 | -0.00273779 | 0.491979 | 172.274 |
| 2 | 03960045 | 0.488605 | 0.000636011 | 171.058 | 03960039 | 0.00000 | 0.489241 | 139.150 |
| 3 | 03960040 | 0.488968 | 0.000272989 | 90.4585 | 03960043 | -0.00205593 | 0.491297 | 118.657 |