| Red | Green | Blue | |
| z | 17.64 | ||
| znorm | Inf | ||
| sky | -Inf | -Inf | -Inf |
| S/N | 30.4 | 49.8 | 53.6 |
| S/N(c) | 0.0 | 0.0 | 0.0 |
| SN(E/C) |
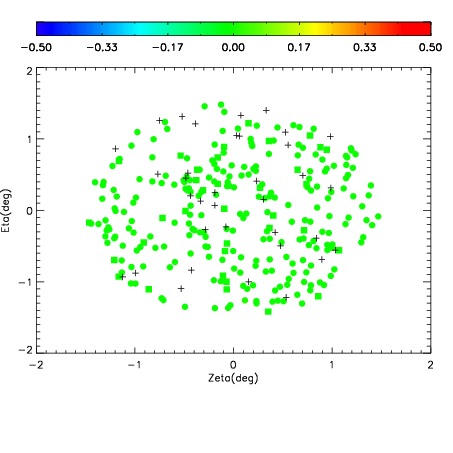
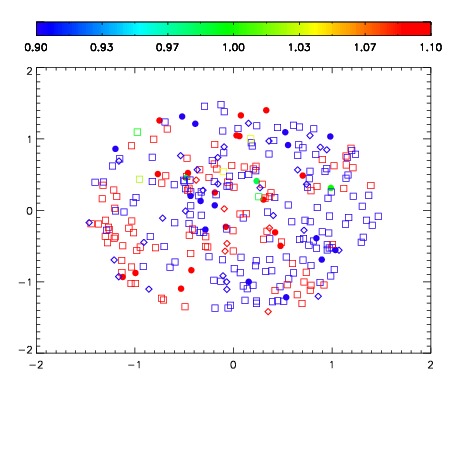
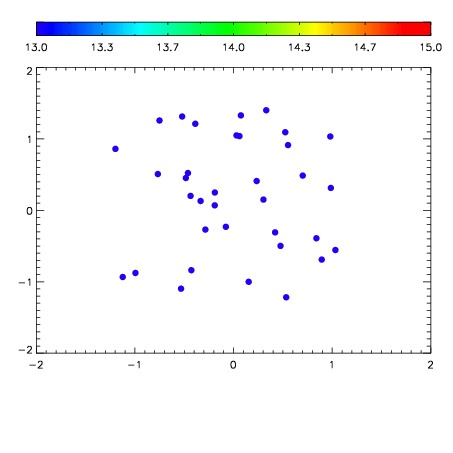

| Frame | Nreads | Zeropoints | Mag plots | Spatial mag deviation | Spatial sky 16325A emission deviations (filled: sky, open: star) | Spatial sky continuum emission | Spatial sky telluric CO2 absorption deviations (filled: H < 10) | |||||||||||||||||||||||
| 0 | 0 |
|
|
|
|
|
|
| IPAIR | NAME | SHIFT | NEWSHIFT | S/N | NAME | SHIFT | NEWSHIFT | S/N |
| 0 | 10150043 | 0.489050 | 0.00000 | 217.311 | 10150041 | 0.000760289 | 0.488290 | 213.605 |
| 1 | 10150042 | 0.488888 | 0.000162005 | 217.611 | 10150044 | -3.57706e-05 | 0.489086 | 221.277 |
| 2 | 10150039 | 0.487932 | 0.00111800 | 205.874 | 10150040 | 0.00104638 | 0.488004 | 206.772 |
| 3 | 10150038 | 0.488408 | 0.000642002 | 202.669 | 10150037 | 0.00000 | 0.489050 | 203.029 |