| Red | Green | Blue | |
| z | 17.64 | ||
| znorm | Inf | ||
| sky | -Inf | -Inf | -Inf |
| S/N | 27.4 | 47.2 | 51.8 |
| S/N(c) | 0.0 | 0.0 | 0.0 |
| SN(E/C) |
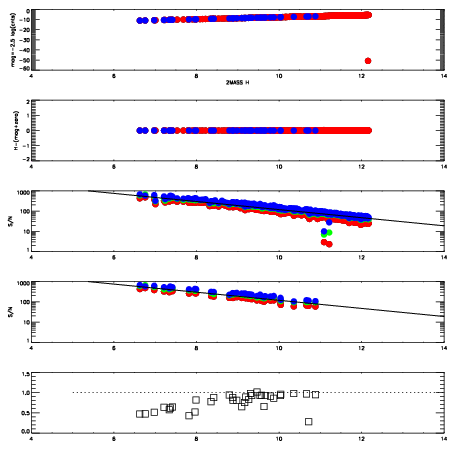
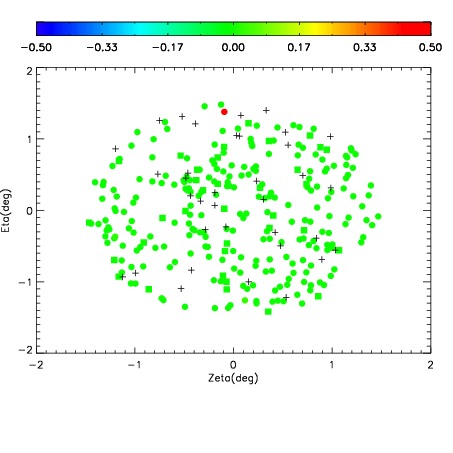
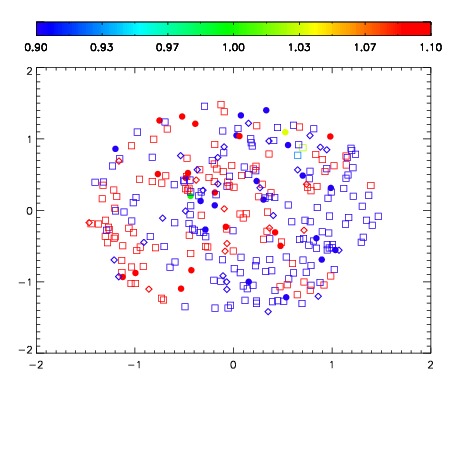
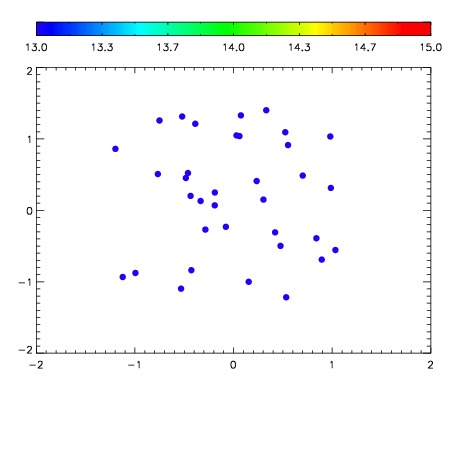

| Frame | Nreads | Zeropoints | Mag plots | Spatial mag deviation | Spatial sky 16325A emission deviations (filled: sky, open: star) | Spatial sky continuum emission | Spatial sky telluric CO2 absorption deviations (filled: H < 10) | |||||||||||||||||||||||
| 0 | 0 |
|
|
|
|
|
|
| IPAIR | NAME | SHIFT | NEWSHIFT | S/N | NAME | SHIFT | NEWSHIFT | S/N |
| 0 | 10210038 | 0.495826 | 0.00000 | 197.471 | 10210040 | 0.00204057 | 0.493785 | 193.651 |
| 1 | 10210039 | 0.495522 | 0.000304013 | 206.252 | 10210037 | 0.00000 | 0.495826 | 203.169 |
| 2 | 10210042 | 0.491888 | 0.00393802 | 202.847 | 10210041 | 0.00132278 | 0.494503 | 199.100 |
| 3 | 10210043 | 0.492394 | 0.00343201 | 185.143 | 10210044 | 0.00231930 | 0.493507 | 191.728 |