| Red | Green | Blue | |
| z | 17.64 | ||
| znorm | Inf | ||
| sky | -Inf | -Inf | -Inf |
| S/N | 30.1 | 49.4 | 53.7 |
| S/N(c) | 0.0 | 0.0 | 0.0 |
| SN(E/C) |
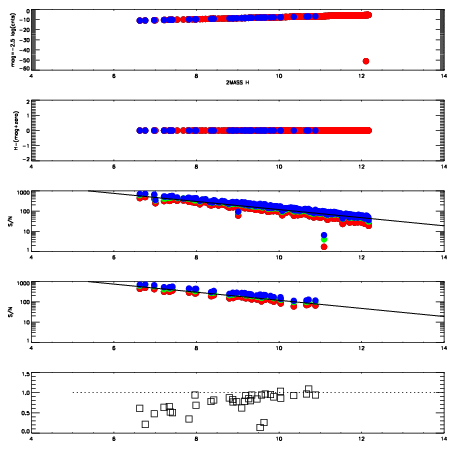
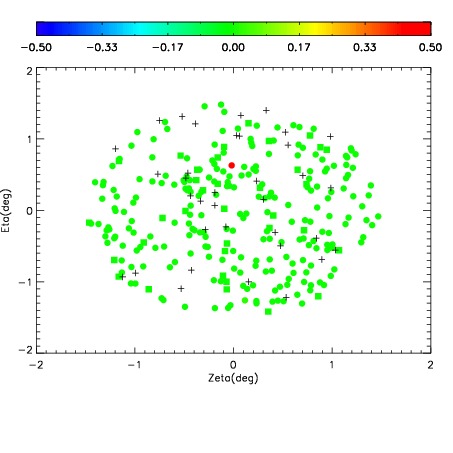
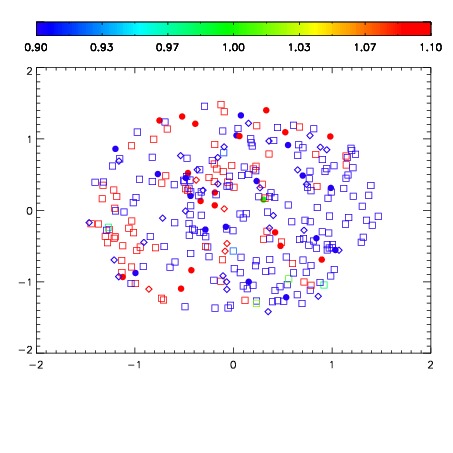
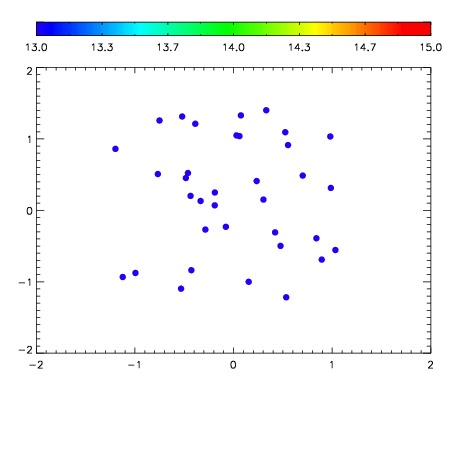

| Frame | Nreads | Zeropoints | Mag plots | Spatial mag deviation | Spatial sky 16325A emission deviations (filled: sky, open: star) | Spatial sky continuum emission | Spatial sky telluric CO2 absorption deviations (filled: H < 10) | |||||||||||||||||||||||
| 0 | 0 |
|
|
|
|
|
|
| IPAIR | NAME | SHIFT | NEWSHIFT | S/N | NAME | SHIFT | NEWSHIFT | S/N |
| 0 | 10430024 | 0.496082 | 0.00000 | 210.920 | 10430022 | 0.00000 | 0.496082 | 211.332 |
| 1 | 10430027 | 0.495639 | 0.000443012 | 225.672 | 10430029 | -0.00577489 | 0.501857 | 223.548 |
| 2 | 10430028 | 0.495739 | 0.000342995 | 222.600 | 10430026 | -0.00553274 | 0.501615 | 218.258 |
| 3 | 10430023 | 0.495563 | 0.000519007 | 219.478 | 10430025 | -0.00582061 | 0.501903 | 215.521 |