| Red | Green | Blue | |
| z | 17.64 | ||
| znorm | Inf | ||
| sky | -Inf | -Inf | -Inf |
| S/N | 27.8 | 46.7 | 51.5 |
| S/N(c) | 0.0 | 0.0 | 0.0 |
| SN(E/C) |
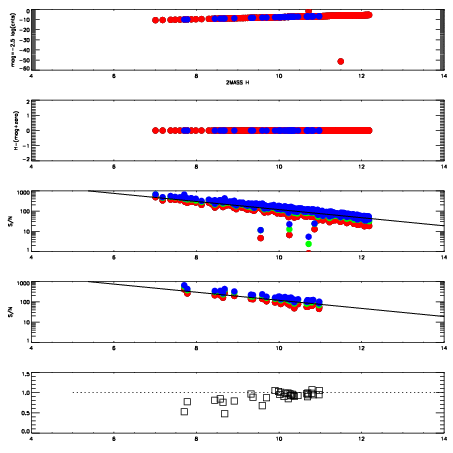
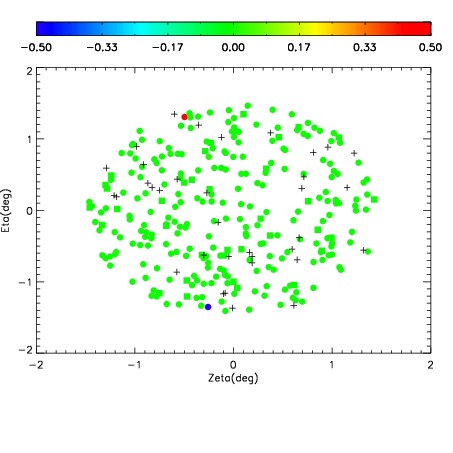
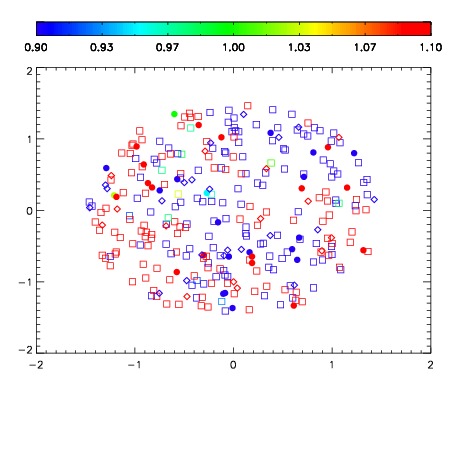
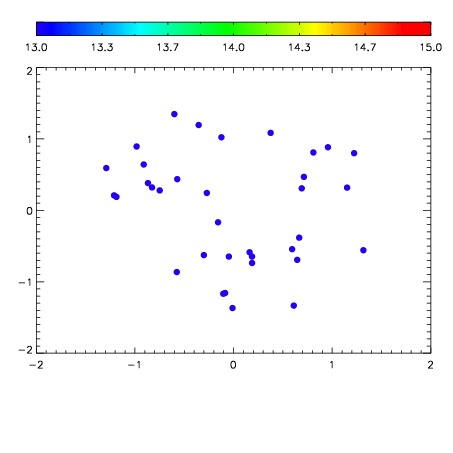

| Frame | Nreads | Zeropoints | Mag plots | Spatial mag deviation | Spatial sky 16325A emission deviations (filled: sky, open: star) | Spatial sky continuum emission | Spatial sky telluric CO2 absorption deviations (filled: H < 10) | |||||||||||||||||||||||
| 0 | 0 |
|
|
|
|
|
|
| IPAIR | NAME | SHIFT | NEWSHIFT | S/N | NAME | SHIFT | NEWSHIFT | S/N |
| 0 | 10230040 | 0.505812 | 0.00000 | 231.903 | 10230042 | 0.00318807 | 0.502624 | 231.939 |
| 1 | 10230043 | 0.503527 | 0.00228500 | 229.011 | 10230041 | 0.00321589 | 0.502596 | 230.986 |
| 2 | 10230039 | 0.505470 | 0.000342011 | 227.789 | 10230045 | 0.00222477 | 0.503587 | 230.136 |
| 3 | 10230044 | 0.502878 | 0.00293398 | 224.005 | 10230038 | 0.00000 | 0.505812 | 223.845 |