| Red | Green | Blue | |
| z | 17.64 | ||
| znorm | Inf | ||
| sky | -NaN | -Inf | -Inf |
| S/N | 24.2 | 41.5 | 46.6 |
| S/N(c) | 0.0 | 0.0 | 0.0 |
| SN(E/C) |
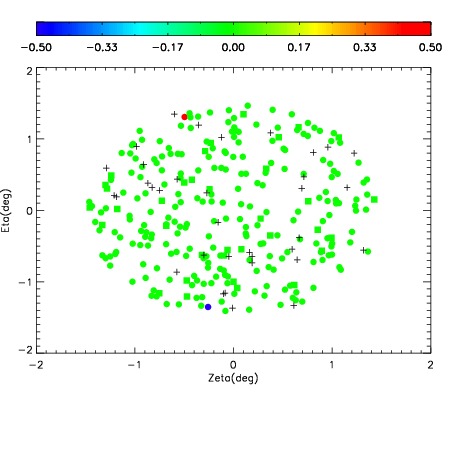
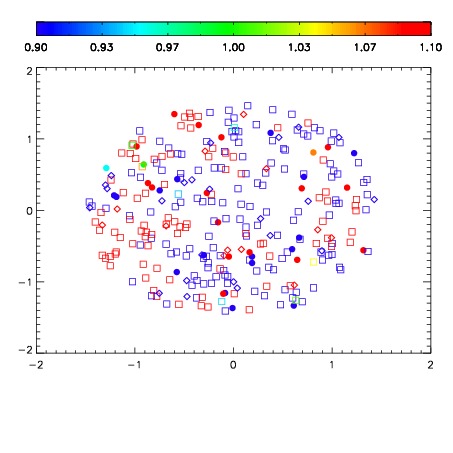
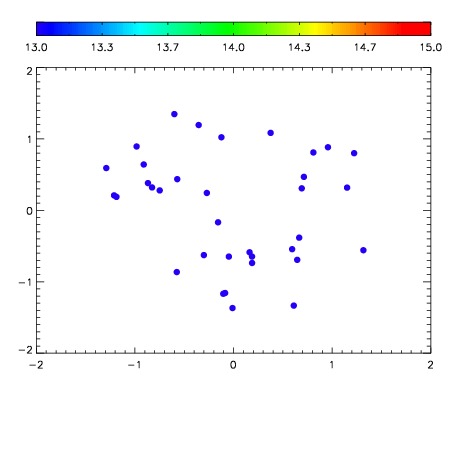

| Frame | Nreads | Zeropoints | Mag plots | Spatial mag deviation | Spatial sky 16325A emission deviations (filled: sky, open: star) | Spatial sky continuum emission | Spatial sky telluric CO2 absorption deviations (filled: H < 10) | |||||||||||||||||||||||
| 0 | 0 |
|
|
|
|
|
|
| IPAIR | NAME | SHIFT | NEWSHIFT | S/N | NAME | SHIFT | NEWSHIFT | S/N |
| 0 | 10270024 | 0.494060 | 0.00000 | 251.795 | 10270022 | 0.00000 | 0.494060 | 221.770 |
| 1 | 10270023 | 0.493392 | 0.000668019 | 253.969 | 10270025 | 0.00136539 | 0.492695 | 239.010 |
| 2 | 10270027 | 0.493962 | 9.80198e-05 | 213.010 | 10270026 | 0.00133182 | 0.492728 | 214.275 |
| 3 | 10270028 | 0.493964 | 9.60231e-05 | 197.000 | 10270029 | 0.00367655 | 0.490383 | 128.313 |