| Red | Green | Blue | |
| z | 17.64 | ||
| znorm | Inf | ||
| sky | -Inf | -Inf | -Inf |
| S/N | 25.0 | 44.1 | 47.0 |
| S/N(c) | 0.0 | 0.0 | 0.0 |
| SN(E/C) |
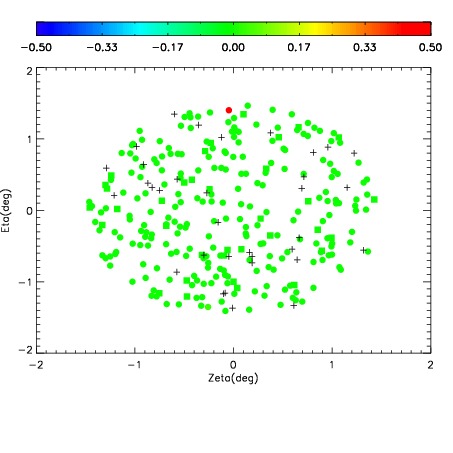
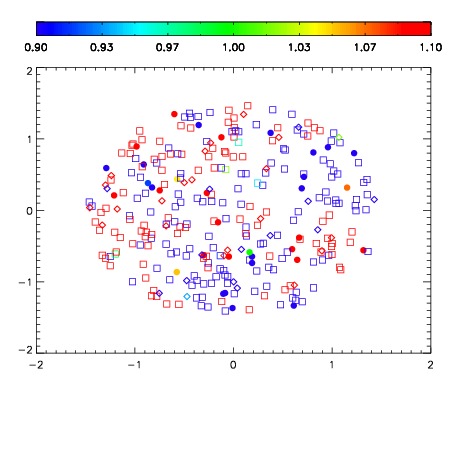
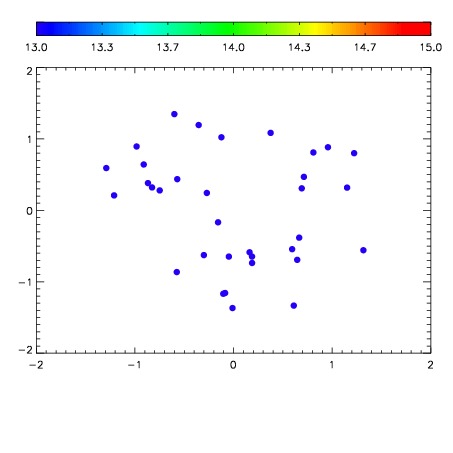

| Frame | Nreads | Zeropoints | Mag plots | Spatial mag deviation | Spatial sky 16325A emission deviations (filled: sky, open: star) | Spatial sky continuum emission | Spatial sky telluric CO2 absorption deviations (filled: H < 10) | |||||||||||||||||||||||
| 0 | 0 |
|
|
|
|
|
|
| IPAIR | NAME | SHIFT | NEWSHIFT | S/N | NAME | SHIFT | NEWSHIFT | S/N |
| 0 | 10520014 | 0.496845 | 0.00000 | 206.447 | 10520015 | 0.00248873 | 0.494356 | 211.024 |
| 1 | 10520013 | 0.496720 | 0.000125021 | 209.502 | 10520012 | 0.00000 | 0.496845 | 214.084 |
| 2 | 10520017 | 0.496158 | 0.000687003 | 203.675 | 10520016 | 0.00205444 | 0.494791 | 199.552 |
| 3 | 10520018 | 0.496483 | 0.000362009 | 185.903 | 10520019 | 0.0176949 | 0.479150 | 199.301 |