| Red | Green | Blue | |
| z | 17.64 | ||
| znorm | Inf | ||
| sky | -Inf | -Inf | -Inf |
| S/N | 29.8 | 48.7 | 51.3 |
| S/N(c) | 0.0 | 0.0 | 0.0 |
| SN(E/C) |

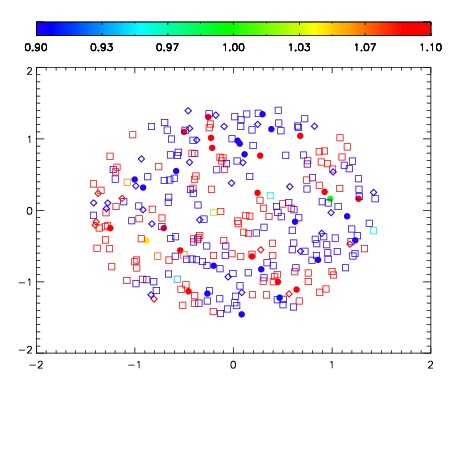
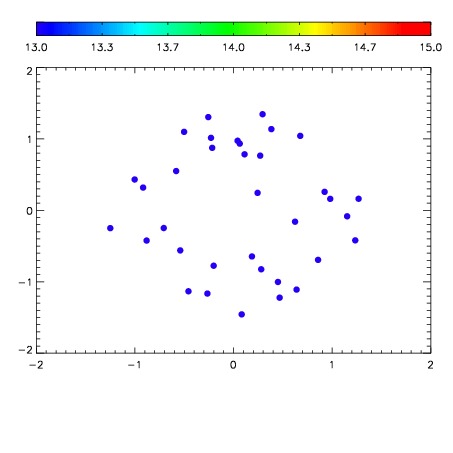

| Frame | Nreads | Zeropoints | Mag plots | Spatial mag deviation | Spatial sky 16325A emission deviations (filled: sky, open: star) | Spatial sky continuum emission | Spatial sky telluric CO2 absorption deviations (filled: H < 10) | |||||||||||||||||||||||
| 0 | 0 |
|
|
|
|
|
|
| IPAIR | NAME | SHIFT | NEWSHIFT | S/N | NAME | SHIFT | NEWSHIFT | S/N |
| 0 | 10240028 | 0.503171 | 0.00000 | 225.200 | 10240029 | 0.00102148 | 0.502150 | 224.832 |
| 1 | 10240032 | 0.501734 | 0.00143701 | 226.322 | 10240033 | 0.00180750 | 0.501364 | 229.227 |
| 2 | 10240031 | 0.500830 | 0.00234103 | 224.203 | 10240030 | 0.00129251 | 0.501878 | 224.573 |
| 3 | 10240027 | 0.502581 | 0.000590026 | 222.225 | 10240026 | 0.00000 | 0.503171 | 219.216 |