| Red | Green | Blue | |
| z | 17.64 | ||
| znorm | Inf | ||
| sky | -Inf | -Inf | -Inf |
| S/N | 20.5 | 34.1 | 37.2 |
| S/N(c) | 0.0 | 0.0 | 0.0 |
| SN(E/C) |
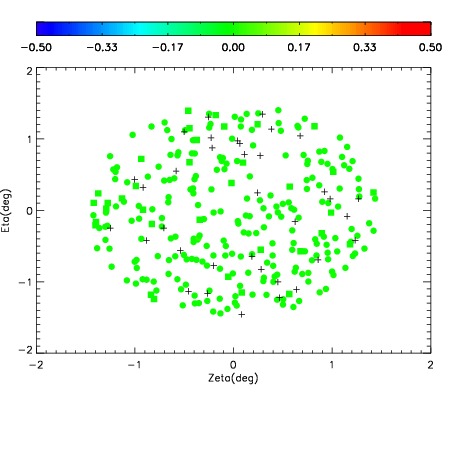
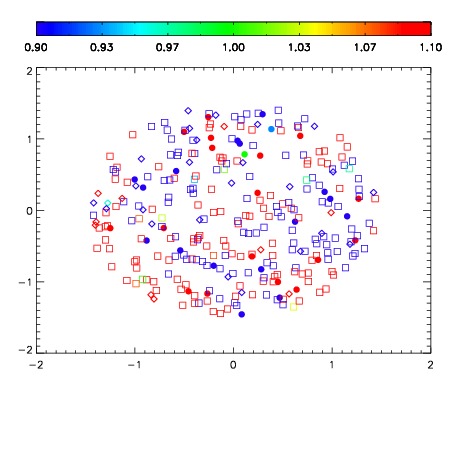
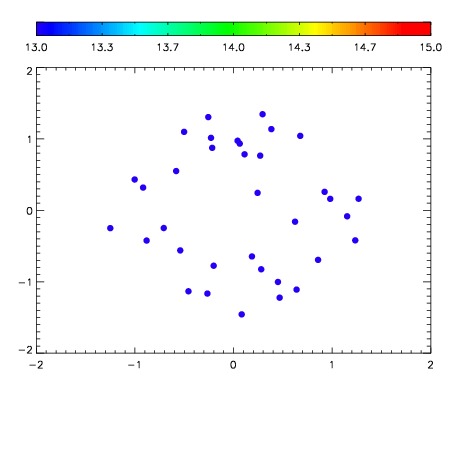

| Frame | Nreads | Zeropoints | Mag plots | Spatial mag deviation | Spatial sky 16325A emission deviations (filled: sky, open: star) | Spatial sky continuum emission | Spatial sky telluric CO2 absorption deviations (filled: H < 10) | |||||||||||||||||||||||
| 0 | 0 |
|
|
|
|
|
|
| IPAIR | NAME | SHIFT | NEWSHIFT | S/N | NAME | SHIFT | NEWSHIFT | S/N |
| 0 | 10420027 | 0.511924 | 0.00000 | 213.376 | 10420026 | 0.00180778 | 0.510116 | 203.836 |
| 1 | 10420024 | 0.511281 | 0.000643015 | 205.547 | 10420025 | 0.00212977 | 0.509794 | 197.992 |
| 2 | 10420023 | 0.511471 | 0.000453055 | 191.135 | 10420022 | 0.00000 | 0.511924 | 191.932 |