| Red | Green | Blue | |
| z | 17.64 | ||
| znorm | Inf | ||
| sky | -Inf | -Inf | -Inf |
| S/N | 22.8 | 40.6 | 42.1 |
| S/N(c) | 0.0 | 0.0 | 0.0 |
| SN(E/C) |
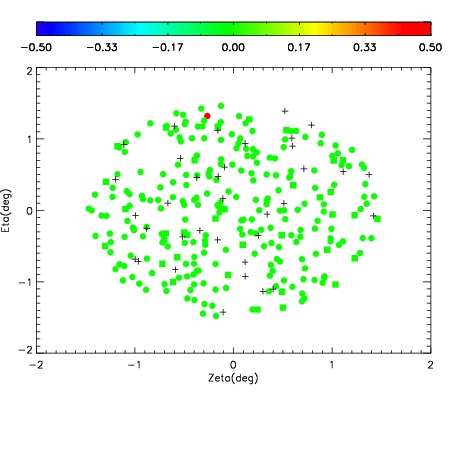

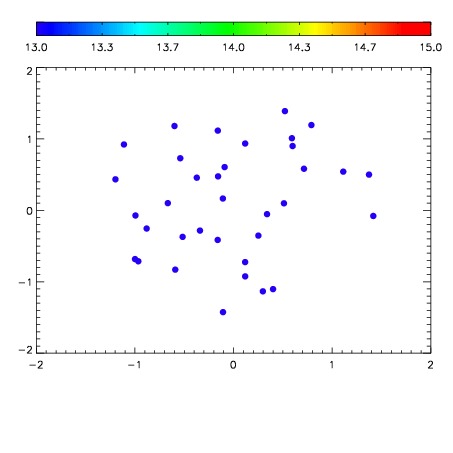

| Frame | Nreads | Zeropoints | Mag plots | Spatial mag deviation | Spatial sky 16325A emission deviations (filled: sky, open: star) | Spatial sky continuum emission | Spatial sky telluric CO2 absorption deviations (filled: H < 10) | |||||||||||||||||||||||
| 0 | 0 |
|
|
|
|
|
|
| IPAIR | NAME | SHIFT | NEWSHIFT | S/N | NAME | SHIFT | NEWSHIFT | S/N |
| 0 | 03440010 | 0.514322 | 0.00000 | 132.200 | 03440008 | 0.00000 | 0.514322 | 139.288 |
| 1 | 03440009 | 0.509162 | 0.00515997 | 131.743 | 03440011 | -0.000241854 | 0.514564 | 129.299 |
| 2 | 03440013 | 0.494260 | 0.0200620 | 126.144 | 03440012 | -0.00319874 | 0.517521 | 121.283 |
| 3 | 03440014 | 0.496620 | 0.0177020 | 123.737 | 03440015 | -0.00240210 | 0.516724 | 108.940 |