| Red | Green | Blue | |
| z | 17.64 | ||
| znorm | Inf | ||
| sky | -NaN | -Inf | -Inf |
| S/N | 29.1 | 47.1 | 50.5 |
| S/N(c) | 0.0 | 0.0 | 0.0 |
| SN(E/C) |
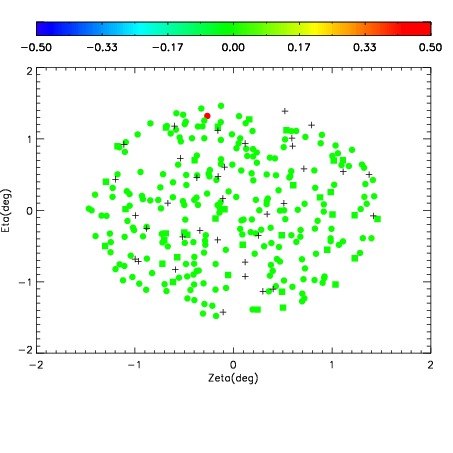
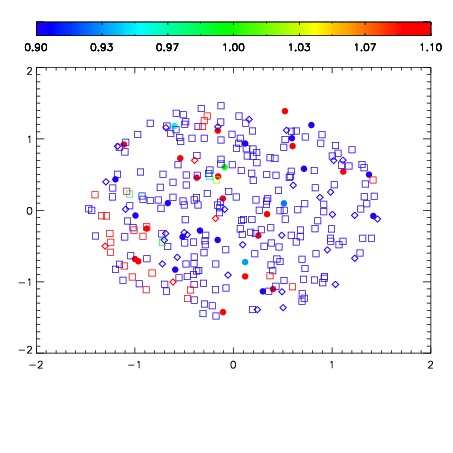
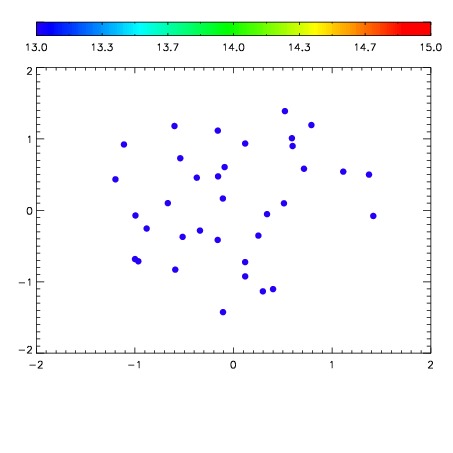

| Frame | Nreads | Zeropoints | Mag plots | Spatial mag deviation | Spatial sky 16325A emission deviations (filled: sky, open: star) | Spatial sky continuum emission | Spatial sky telluric CO2 absorption deviations (filled: H < 10) | |||||||||||||||||||||||
| 0 | 0 |
|
|
|
|
|
|
| IPAIR | NAME | SHIFT | NEWSHIFT | S/N | NAME | SHIFT | NEWSHIFT | S/N |
| 0 | 09990027 | 0.518208 | 0.00000 | 187.339 | 09990026 | 0.00000 | 0.518208 | 171.789 |
| 1 | 09990032 | 0.516244 | 0.00196403 | 192.859 | 09990029 | 0.00199871 | 0.516209 | 192.812 |
| 2 | 09990028 | 0.518177 | 3.10540e-05 | 187.759 | 09990030 | 0.00188463 | 0.516323 | 189.204 |
| 3 | 09990031 | 0.516481 | 0.00172704 | 180.344 | 09990033 | 0.000722058 | 0.517486 | 156.696 |