| Red | Green | Blue | |
| z | 17.64 | ||
| znorm | Inf | ||
| sky | -Inf | -Inf | -Inf |
| S/N | 27.7 | 46.5 | 52.4 |
| S/N(c) | 0.0 | 0.0 | 0.0 |
| SN(E/C) |
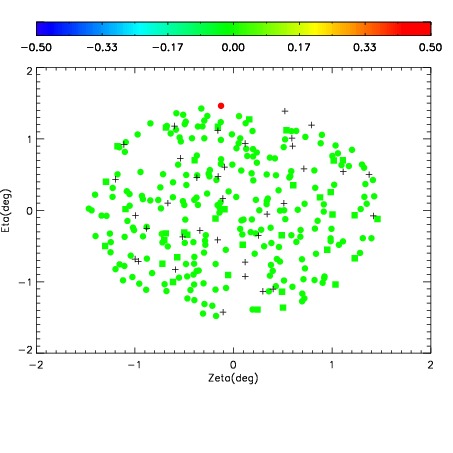
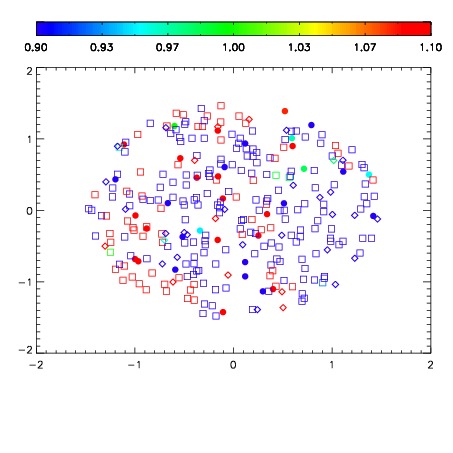
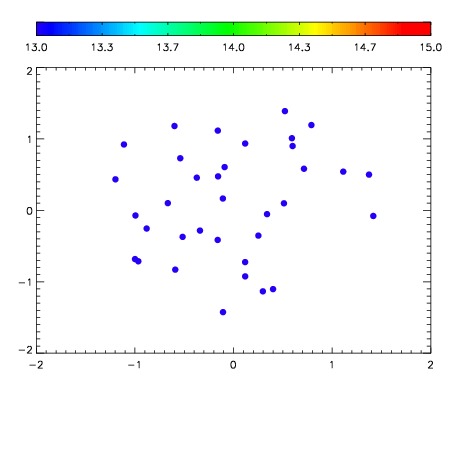

| Frame | Nreads | Zeropoints | Mag plots | Spatial mag deviation | Spatial sky 16325A emission deviations (filled: sky, open: star) | Spatial sky continuum emission | Spatial sky telluric CO2 absorption deviations (filled: H < 10) | |||||||||||||||||||||||
| 0 | 0 |
|
|
|
|
|
|
| IPAIR | NAME | SHIFT | NEWSHIFT | S/N | NAME | SHIFT | NEWSHIFT | S/N |
| 0 | 10160045 | 0.506624 | 0.00000 | 194.240 | 10160039 | 0.00000 | 0.506624 | 193.125 |
| 1 | 10160044 | 0.506393 | 0.000230968 | 195.919 | 10160046 | 0.000547135 | 0.506077 | 193.548 |
| 2 | 10160041 | 0.500006 | 0.00661796 | 193.216 | 10160042 | 0.00118467 | 0.505439 | 188.210 |
| 3 | 10160040 | 0.499564 | 0.00705999 | 190.981 | 10160043 | 0.000993298 | 0.505631 | 187.288 |