| Red | Green | Blue | |
| z | 17.64 | ||
| znorm | Inf | ||
| sky | -Inf | -NaN | -Inf |
| S/N | 26.5 | 44.8 | 46.6 |
| S/N(c) | 0.0 | 0.0 | 0.0 |
| SN(E/C) |
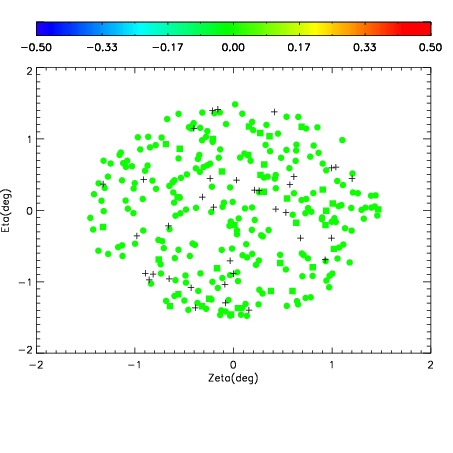
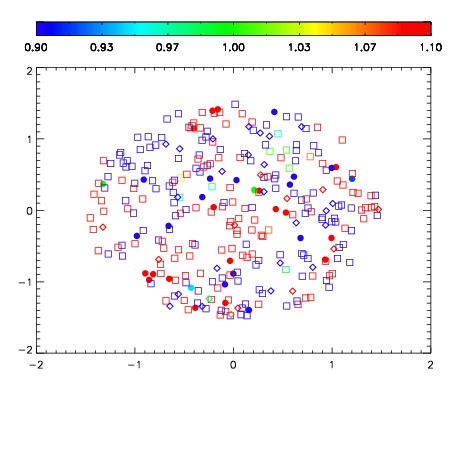
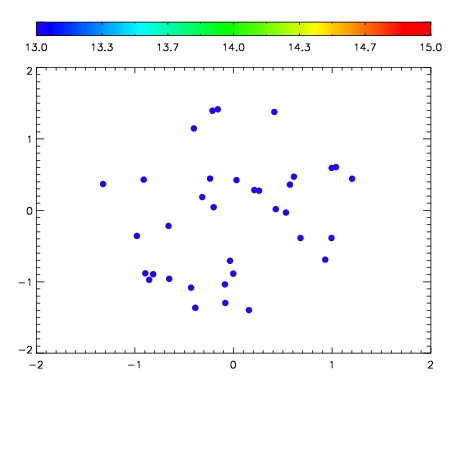

| Frame | Nreads | Zeropoints | Mag plots | Spatial mag deviation | Spatial sky 16325A emission deviations (filled: sky, open: star) | Spatial sky continuum emission | Spatial sky telluric CO2 absorption deviations (filled: H < 10) | |||||||||||||||||||||||
| 0 | 0 |
|
|
|
|
|
|
| IPAIR | NAME | SHIFT | NEWSHIFT | S/N | NAME | SHIFT | NEWSHIFT | S/N |
| 0 | 03430010 | 0.501765 | 0.00000 | 189.392 | 03430011 | 0.00140534 | 0.500360 | 184.942 |
| 1 | 03430014 | 0.501160 | 0.000604987 | 202.147 | 03430015 | 0.00158541 | 0.500180 | 202.525 |
| 2 | 03430009 | 0.501083 | 0.000681996 | 189.398 | 03430012 | 0.00160496 | 0.500160 | 188.705 |
| 3 | 03430013 | 0.499171 | 0.00259402 | 189.391 | 03430008 | 0.00000 | 0.501765 | 177.331 |