| Red | Green | Blue | |
| z | 17.64 | ||
| znorm | Inf | ||
| sky | -Inf | -Inf | -Inf |
| S/N | 21.9 | 37.6 | 40.0 |
| S/N(c) | 0.0 | 0.0 | 0.0 |
| SN(E/C) |
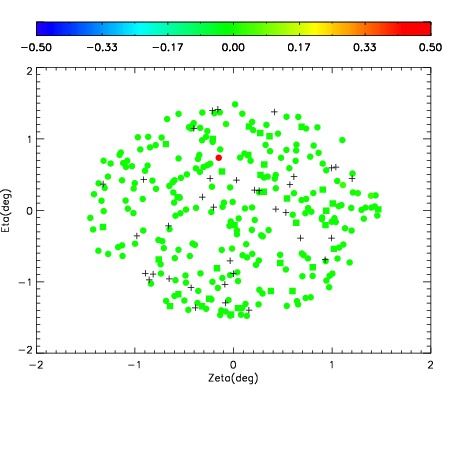
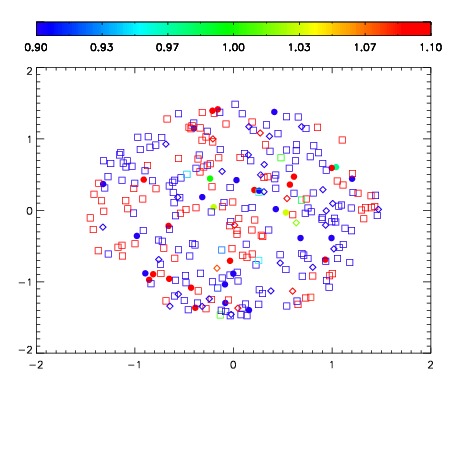
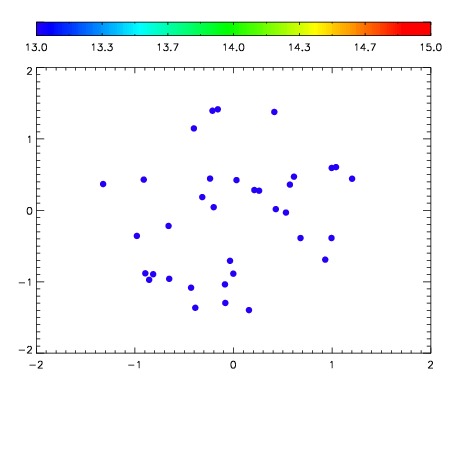

| Frame | Nreads | Zeropoints | Mag plots | Spatial mag deviation | Spatial sky 16325A emission deviations (filled: sky, open: star) | Spatial sky continuum emission | Spatial sky telluric CO2 absorption deviations (filled: H < 10) | |||||||||||||||||||||||
| 0 | 0 |
|
|
|
|
|
|
| IPAIR | NAME | SHIFT | NEWSHIFT | S/N | NAME | SHIFT | NEWSHIFT | S/N |
| 0 | 06670039 | 0.475743 | 0.00000 | 211.516 | 06670040 | 0.00627609 | 0.469467 | 214.030 |
| 1 | 06670038 | 0.474528 | 0.00121498 | 212.412 | 06670044 | 0.00423195 | 0.471511 | 220.525 |
| 2 | 06670043 | 0.475252 | 0.000490993 | 210.734 | 06670041 | 0.00365615 | 0.472087 | 213.604 |