| Red | Green | Blue | |
| z | 17.64 | ||
| znorm | Inf | ||
| sky | -Inf | -NaN | -Inf |
| S/N | 14.5 | 25.0 | 26.2 |
| S/N(c) | 0.0 | 0.0 | 0.0 |
| SN(E/C) |
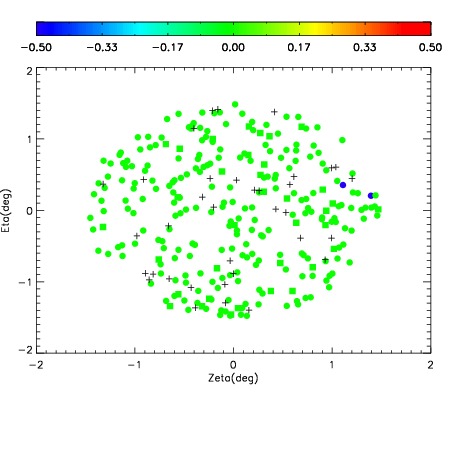
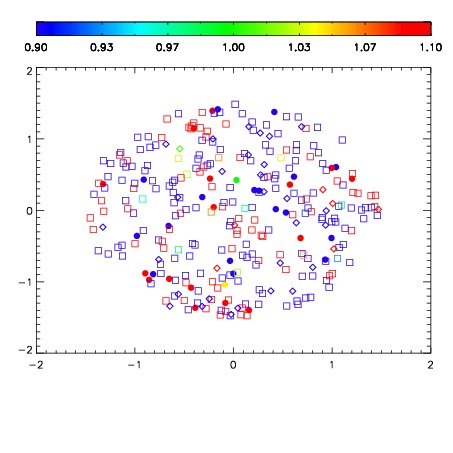
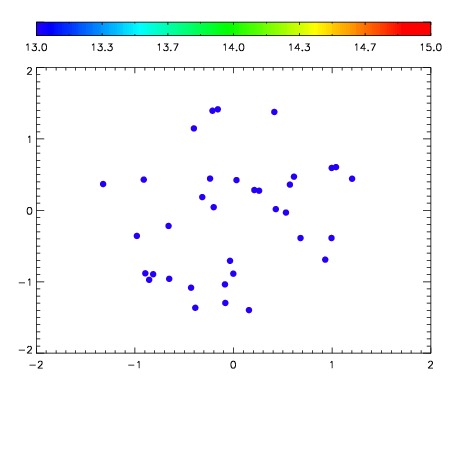

| Frame | Nreads | Zeropoints | Mag plots | Spatial mag deviation | Spatial sky 16325A emission deviations (filled: sky, open: star) | Spatial sky continuum emission | Spatial sky telluric CO2 absorption deviations (filled: H < 10) | |||||||||||||||||||||||
| 0 | 0 |
|
|
|
|
|
|
| IPAIR | NAME | SHIFT | NEWSHIFT | S/N | NAME | SHIFT | NEWSHIFT | S/N |
| 0 | 09200012 | 0.480458 | 0.00000 | 149.935 | 09200011 | 0.00000 | 0.480458 | 137.299 |
| 1 | 09200013 | 0.480416 | 4.19915e-05 | 150.517 | 09200014 | 0.00212653 | 0.478331 | 151.305 |