| Red | Green | Blue | |
| z | 17.64 | ||
| znorm | Inf | ||
| sky | -Inf | -Inf | -Inf |
| S/N | 29.3 | 48.3 | 51.5 |
| S/N(c) | 0.0 | 0.0 | 0.0 |
| SN(E/C) |
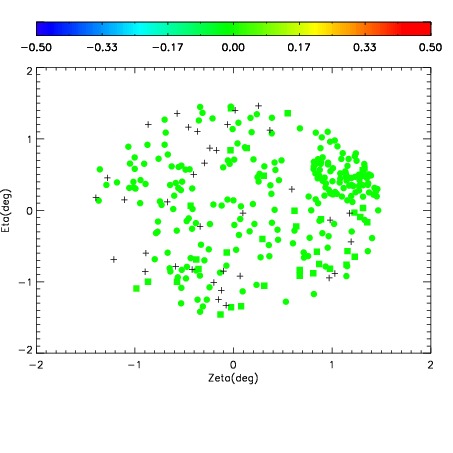
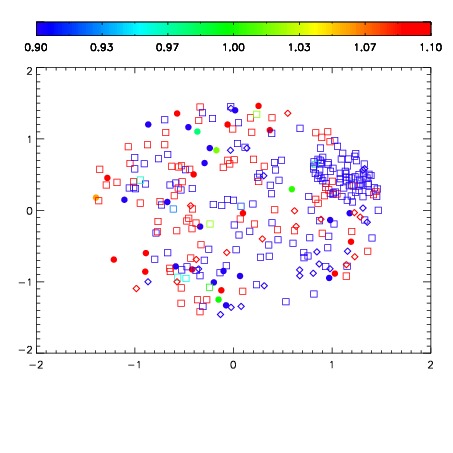
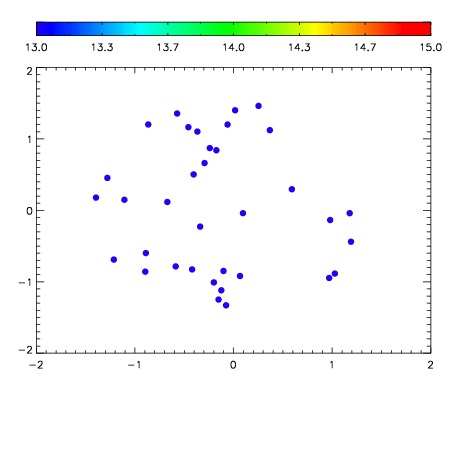

| Frame | Nreads | Zeropoints | Mag plots | Spatial mag deviation | Spatial sky 16325A emission deviations (filled: sky, open: star) | Spatial sky continuum emission | Spatial sky telluric CO2 absorption deviations (filled: H < 10) | |||||||||||||||||||||||
| 0 | 0 |
|
|
|
|
|
|
| IPAIR | NAME | SHIFT | NEWSHIFT | S/N | NAME | SHIFT | NEWSHIFT | S/N |
| 0 | 06950027 | 0.498593 | 0.00000 | 211.875 | 06950032 | 0.000596662 | 0.497996 | 204.641 |
| 1 | 06950026 | 0.498156 | 0.000436991 | 219.336 | 06950025 | 0.00000 | 0.498593 | 223.046 |
| 2 | 06950031 | 0.494357 | 0.00423601 | 202.533 | 06950029 | -0.000992170 | 0.499585 | 202.825 |
| 3 | 06950030 | 0.493483 | 0.00511000 | 202.426 | 06950028 | -0.00164283 | 0.500236 | 202.628 |