| Red | Green | Blue | |
| z | 17.64 | ||
| znorm | Inf | ||
| sky | -Inf | -Inf | -Inf |
| S/N | 32.5 | 55.7 | 57.1 |
| S/N(c) | 0.0 | 0.0 | 0.0 |
| SN(E/C) |
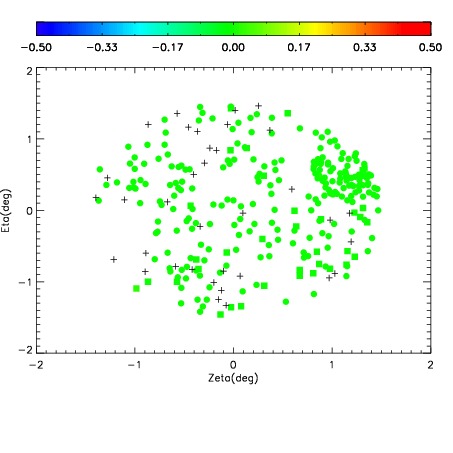
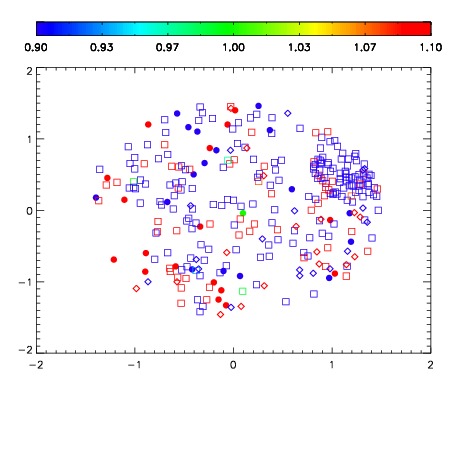
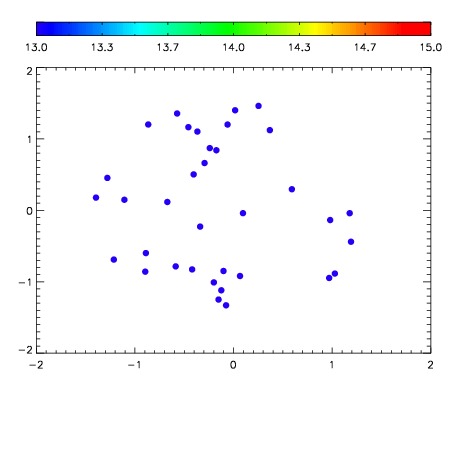

| Frame | Nreads | Zeropoints | Mag plots | Spatial mag deviation | Spatial sky 16325A emission deviations (filled: sky, open: star) | Spatial sky continuum emission | Spatial sky telluric CO2 absorption deviations (filled: H < 10) | |||||||||||||||||||||||
| 0 | 0 |
|
|
|
|
|
|
| IPAIR | NAME | SHIFT | NEWSHIFT | S/N | NAME | SHIFT | NEWSHIFT | S/N |
| 0 | 06990027 | 0.482324 | 0.00000 | 237.480 | 06990028 | 0.000205014 | 0.482119 | 235.621 |
| 1 | 06990026 | 0.477601 | 0.00472301 | 236.552 | 06990025 | 0.00000 | 0.482324 | 235.496 |
| 2 | 06990030 | 0.476924 | 0.00540000 | 234.845 | 06990029 | -0.000317732 | 0.482642 | 235.431 |
| 3 | 06990031 | 0.481023 | 0.00130099 | 233.401 | 06990032 | 0.000543322 | 0.481781 | 232.833 |