| Red | Green | Blue | |
| z | 17.64 | ||
| znorm | Inf | ||
| sky | -Inf | -Inf | -Inf |
| S/N | 19.5 | 34.8 | 36.1 |
| S/N(c) | 0.0 | 0.0 | 0.0 |
| SN(E/C) |
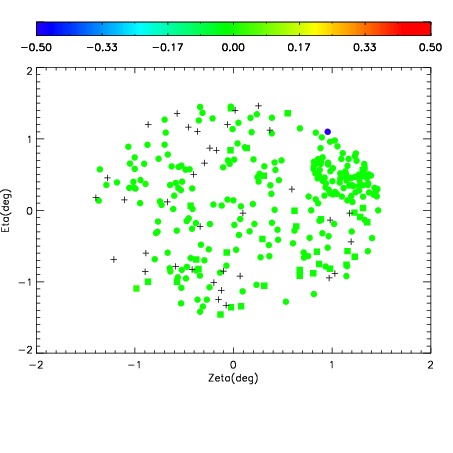
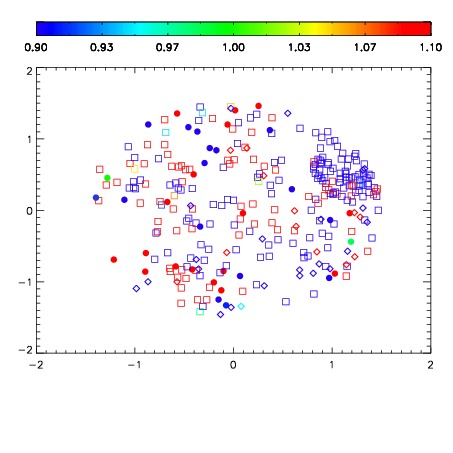
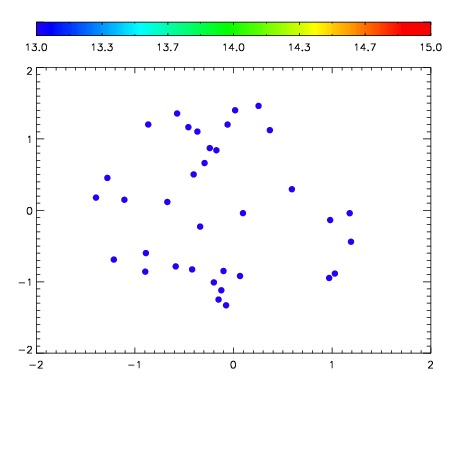

| Frame | Nreads | Zeropoints | Mag plots | Spatial mag deviation | Spatial sky 16325A emission deviations (filled: sky, open: star) | Spatial sky continuum emission | Spatial sky telluric CO2 absorption deviations (filled: H < 10) | |||||||||||||||||||||||
| 0 | 0 |
|
|
|
|
|
|
| IPAIR | NAME | SHIFT | NEWSHIFT | S/N | NAME | SHIFT | NEWSHIFT | S/N |
| 0 | 07220013 | 0.482670 | 0.00000 | 147.555 | 07220014 | 0.00513948 | 0.477531 | 147.678 |
| 1 | 07220016 | 0.480838 | 0.00183201 | 156.274 | 07220011 | 0.00000 | 0.482670 | 183.432 |
| 2 | 07220012 | 0.482629 | 4.10080e-05 | 153.516 | 07220015 | 0.00177866 | 0.480891 | 159.197 |
| 3 | 07220017 | 0.481690 | 0.000980020 | 150.681 | 07220018 | 0.00466878 | 0.478001 | 156.020 |