| Red | Green | Blue | |
| z | 17.64 | ||
| znorm | Inf | ||
| sky | -Inf | -Inf | -Inf |
| S/N | 25.9 | 45.8 | 48.4 |
| S/N(c) | 0.0 | 0.0 | 0.0 |
| SN(E/C) |
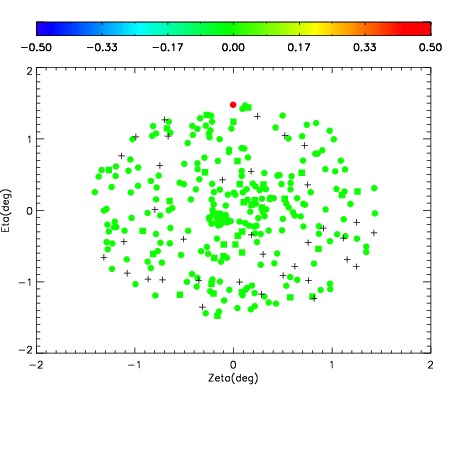
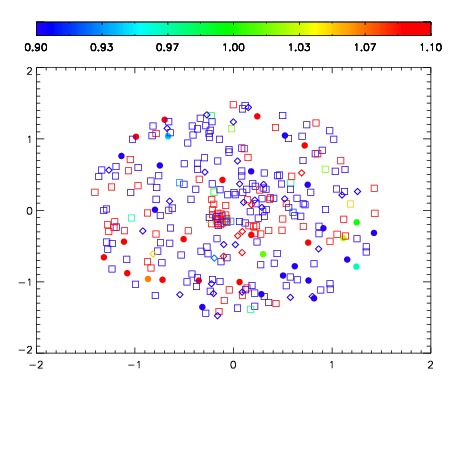
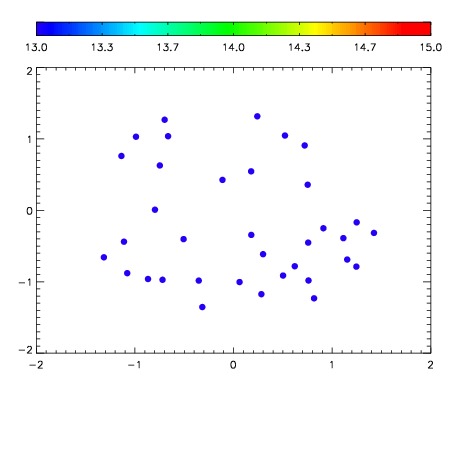

| Frame | Nreads | Zeropoints | Mag plots | Spatial mag deviation | Spatial sky 16325A emission deviations (filled: sky, open: star) | Spatial sky continuum emission | Spatial sky telluric CO2 absorption deviations (filled: H < 10) | |||||||||||||||||||||||
| 0 | 0 |
|
|
|
|
|
|
| IPAIR | NAME | SHIFT | NEWSHIFT | S/N | NAME | SHIFT | NEWSHIFT | S/N |
| 0 | 02930010 | 0.402800 | 0.00000 | 195.272 | 02930011 | 0.00350188 | 0.399298 | 206.322 |
| 1 | 02930014 | 0.400536 | 0.00226399 | 229.687 | 02930015 | 0.00281937 | 0.399981 | 239.690 |
| 2 | 02930013 | 0.398859 | 0.00394100 | 224.051 | 02930008 | 0.00000 | 0.402800 | 225.141 |
| 3 | 02930009 | 0.401158 | 0.00164199 | 199.392 | 02930012 | 0.00313067 | 0.399669 | 208.653 |