| Red | Green | Blue | |
| z | 17.64 | ||
| znorm | Inf | ||
| sky | -Inf | -Inf | -Inf |
| S/N | 26.8 | 45.9 | 49.4 |
| S/N(c) | 0.0 | 0.0 | 0.0 |
| SN(E/C) |
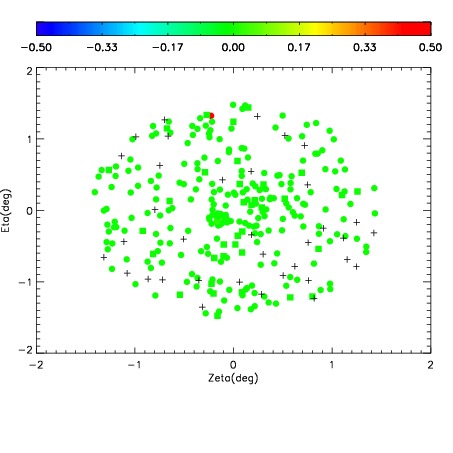
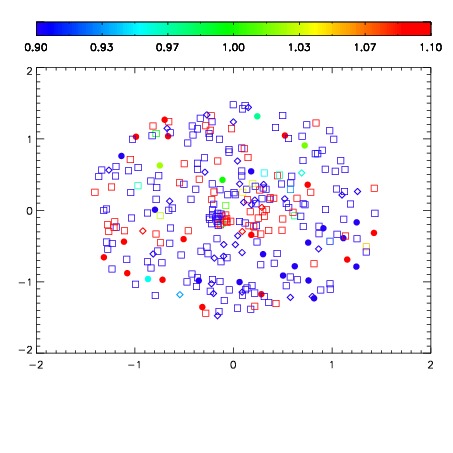
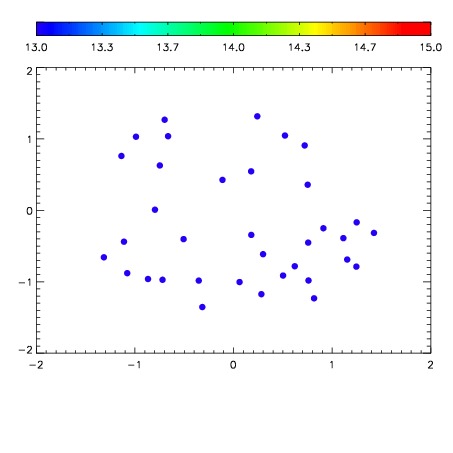

| Frame | Nreads | Zeropoints | Mag plots | Spatial mag deviation | Spatial sky 16325A emission deviations (filled: sky, open: star) | Spatial sky continuum emission | Spatial sky telluric CO2 absorption deviations (filled: H < 10) | |||||||||||||||||||||||
| 0 | 0 |
|
|
|
|
|
|
| IPAIR | NAME | SHIFT | NEWSHIFT | S/N | NAME | SHIFT | NEWSHIFT | S/N |
| 0 | 03200023 | 0.509580 | 0.00000 | 219.467 | 03200028 | -0.00267658 | 0.512257 | 218.540 |
| 1 | 03200022 | 0.502387 | 0.00719303 | 223.641 | 03200025 | -0.00228170 | 0.511862 | 243.558 |
| 2 | 03200026 | 0.496487 | 0.0130930 | 220.460 | 03200024 | -0.000954744 | 0.510535 | 232.130 |
| 3 | 03200027 | 0.504867 | 0.00471300 | 196.934 | 03200021 | 0.00000 | 0.509580 | 210.059 |