| Red | Green | Blue | |
| z | 17.64 | ||
| znorm | Inf | ||
| sky | -Inf | -NaN | -Inf |
| S/N | 26.7 | 47.9 | 52.5 |
| S/N(c) | 0.0 | 0.0 | 0.0 |
| SN(E/C) |
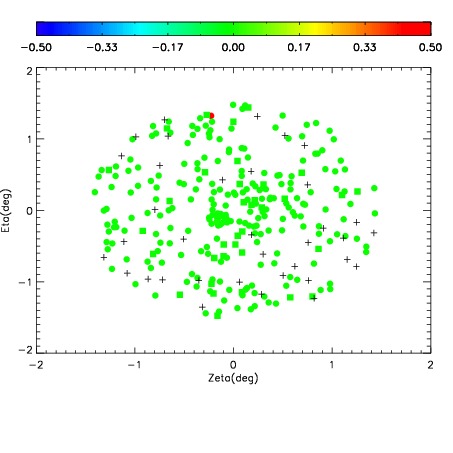
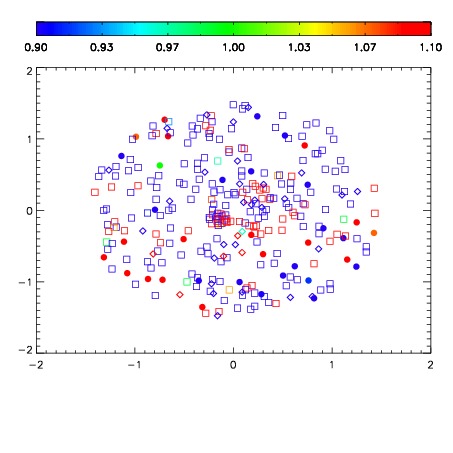
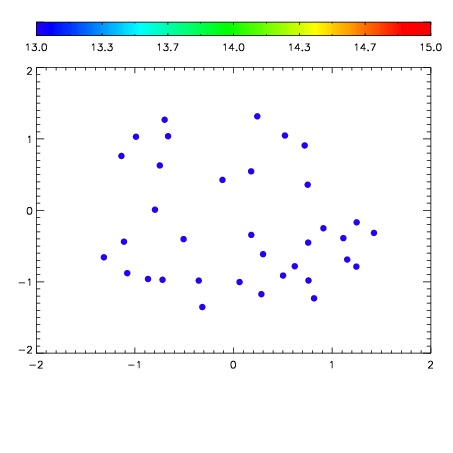

| Frame | Nreads | Zeropoints | Mag plots | Spatial mag deviation | Spatial sky 16325A emission deviations (filled: sky, open: star) | Spatial sky continuum emission | Spatial sky telluric CO2 absorption deviations (filled: H < 10) | |||||||||||||||||||||||
| 0 | 0 |
|
|
|
|
|
|
| IPAIR | NAME | SHIFT | NEWSHIFT | S/N | NAME | SHIFT | NEWSHIFT | S/N |
| 0 | 03410054 | 0.497623 | 0.00000 | 216.410 | 03410055 | -0.000972028 | 0.498595 | 224.069 |
| 1 | 03410050 | 0.496306 | 0.00131699 | 206.942 | 03410052 | -0.00159269 | 0.499216 | 218.763 |
| 2 | 03410049 | 0.495046 | 0.00257701 | 204.086 | 03410051 | -0.00191249 | 0.499536 | 212.324 |
| 3 | 03410053 | 0.496431 | 0.00119200 | 195.698 | 03410048 | 0.00000 | 0.497623 | 205.178 |