| Red | Green | Blue | |
| z | 17.64 | ||
| znorm | Inf | ||
| sky | -Inf | -NaN | -Inf |
| S/N | 28.5 | 49.7 | 54.6 |
| S/N(c) | 0.0 | 0.0 | 0.0 |
| SN(E/C) |
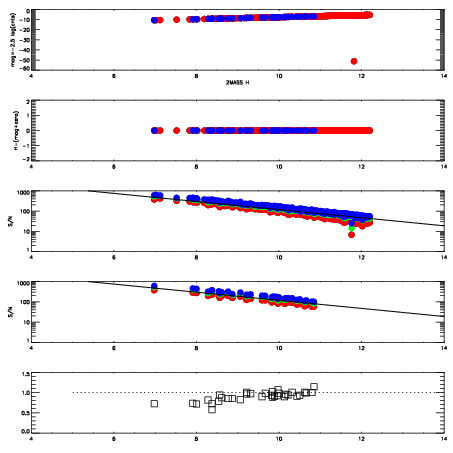
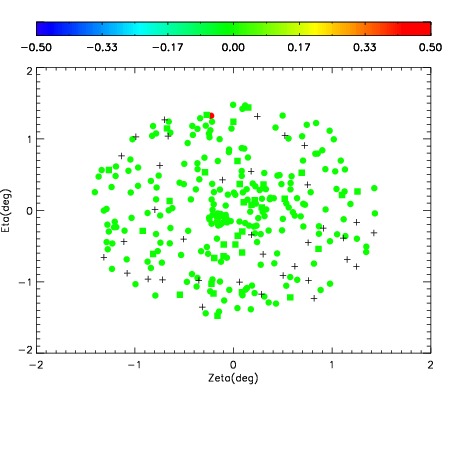
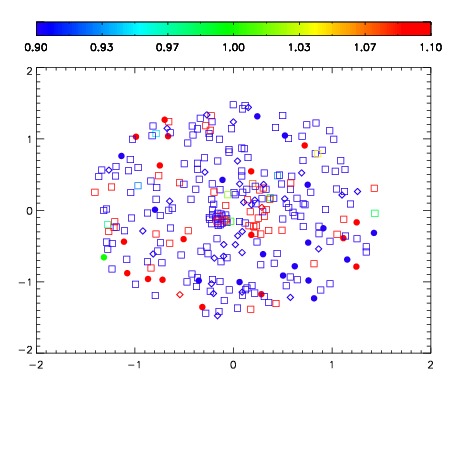
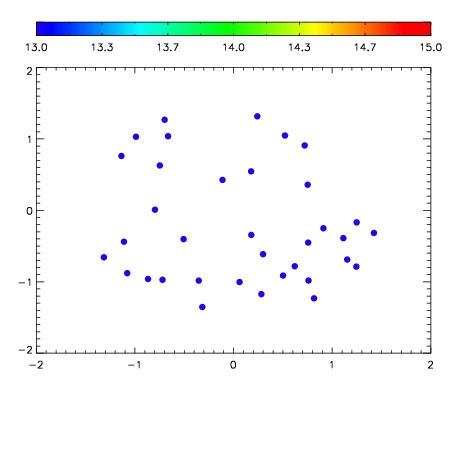

| Frame | Nreads | Zeropoints | Mag plots | Spatial mag deviation | Spatial sky 16325A emission deviations (filled: sky, open: star) | Spatial sky continuum emission | Spatial sky telluric CO2 absorption deviations (filled: H < 10) | |||||||||||||||||||||||
| 0 | 0 |
|
|
|
|
|
|
| IPAIR | NAME | SHIFT | NEWSHIFT | S/N | NAME | SHIFT | NEWSHIFT | S/N |
| 0 | 03700044 | 0.497675 | 0.00000 | 227.066 | 03700042 | -0.00219530 | 0.499870 | 231.607 |
| 1 | 03700043 | 0.491295 | 0.00637999 | 224.018 | 03700041 | -0.00137258 | 0.499048 | 220.973 |
| 2 | 03700040 | 0.497393 | 0.000281990 | 208.635 | 03700045 | -0.00136051 | 0.499036 | 211.510 |
| 3 | 03700039 | 0.494255 | 0.00342000 | 205.932 | 03700038 | 0.00000 | 0.497675 | 198.710 |