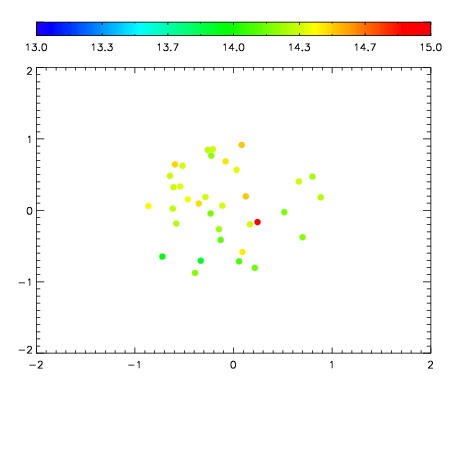
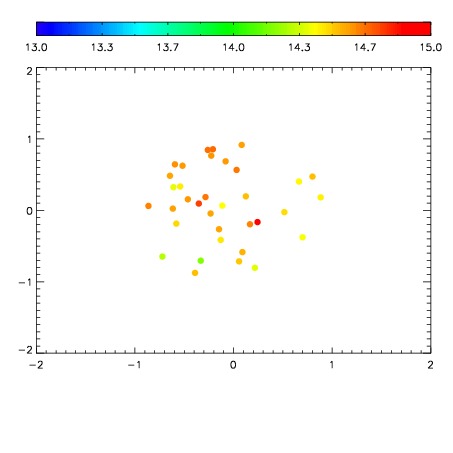
| Frame | Nreads | Zeropoints | Mag plots
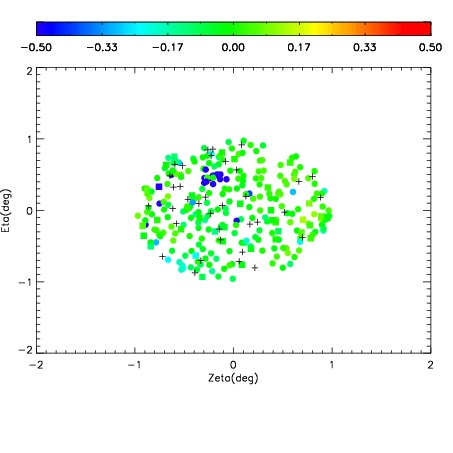
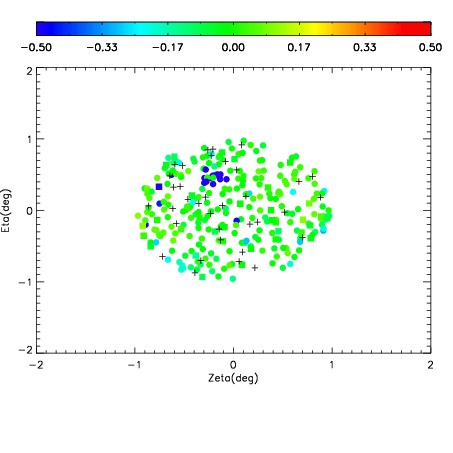
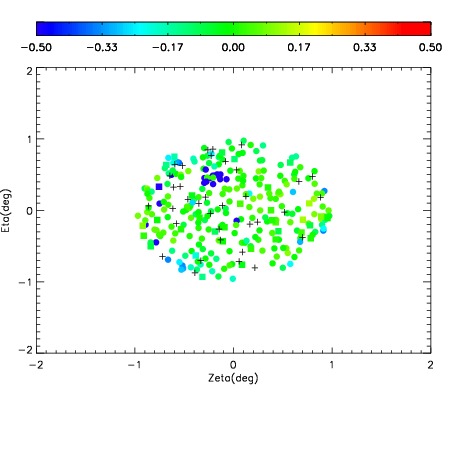
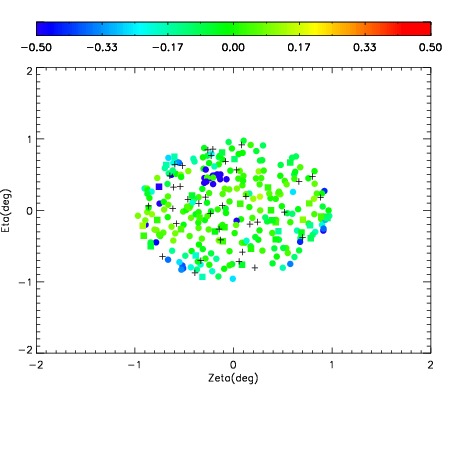
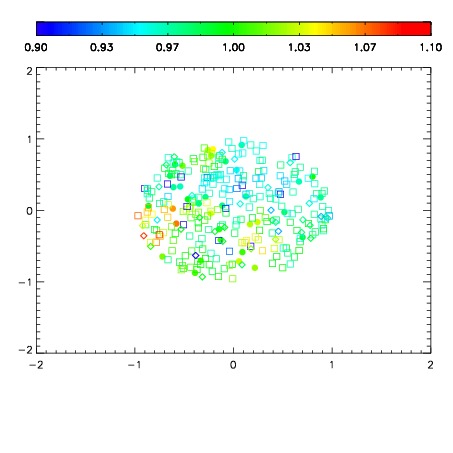
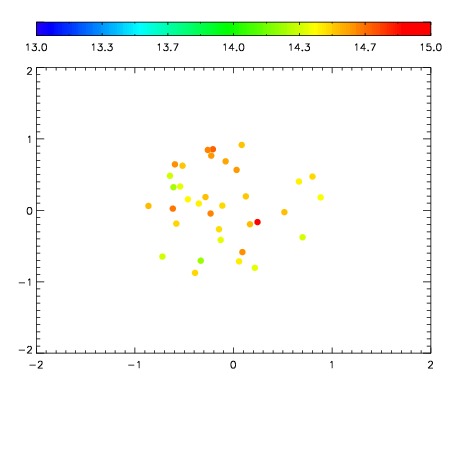
| Spatial mag deviation
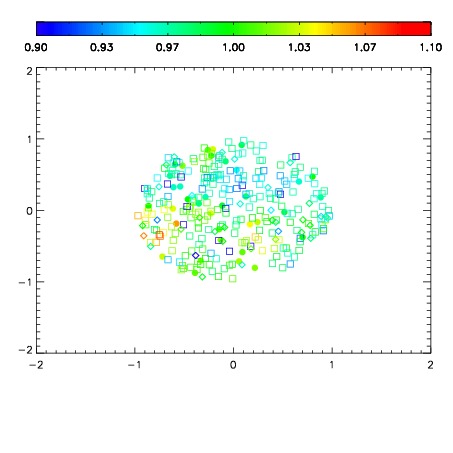
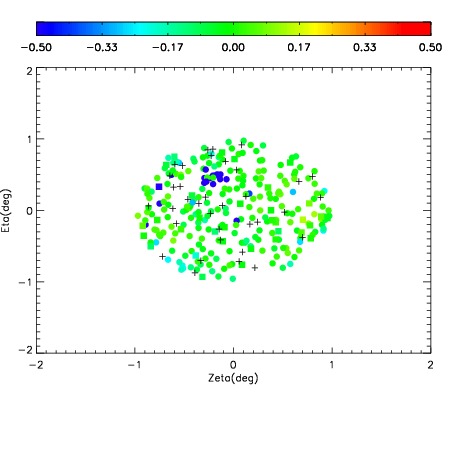
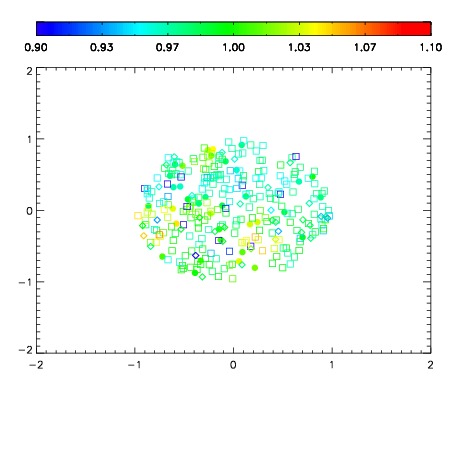
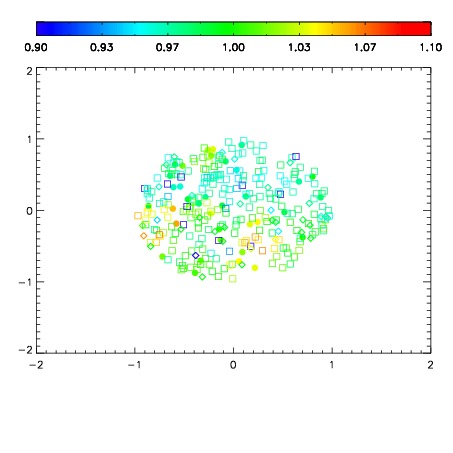
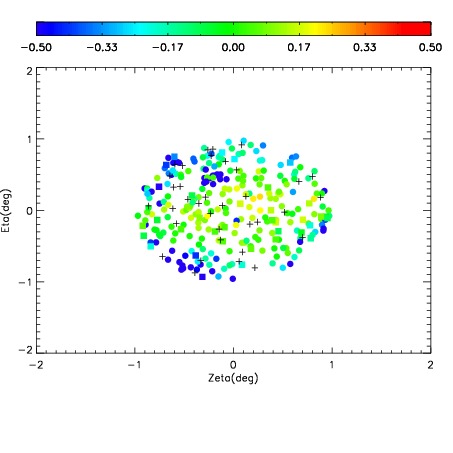
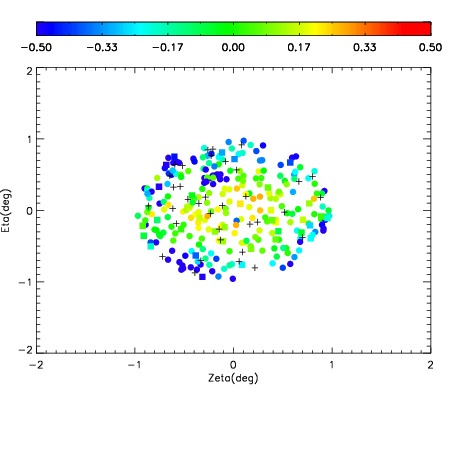
| Spatial sky 16325A emission deviations (filled: sky, open: star)
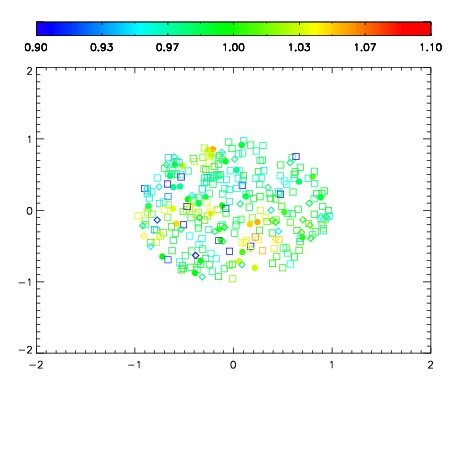
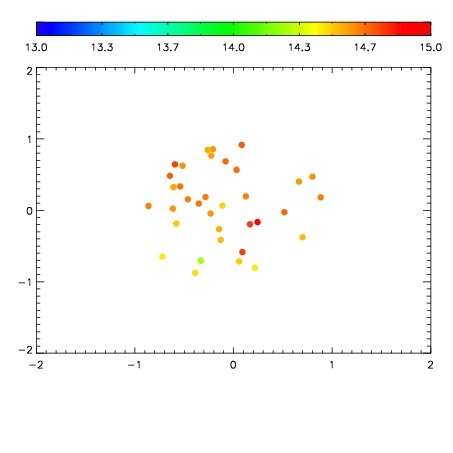
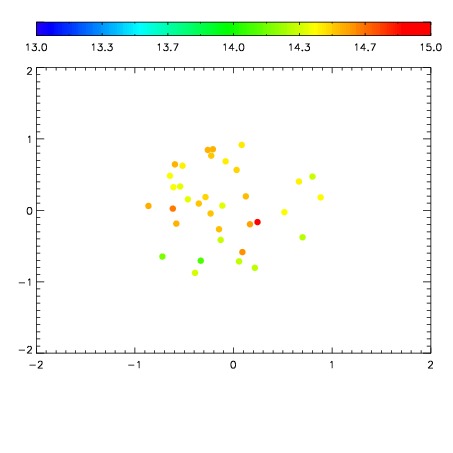
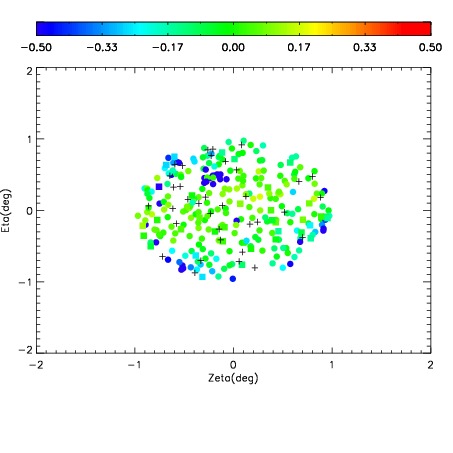
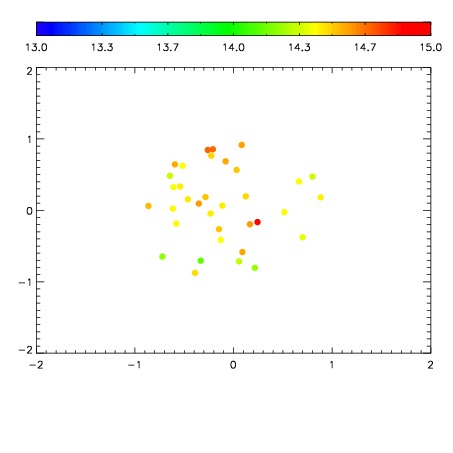
| Spatial sky continuum emission
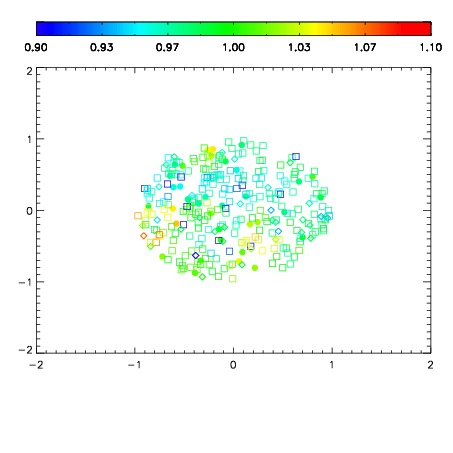
| Spatial sky telluric CO2 absorption deviations (filled: H < 10)
|
| 3190056
| 47
| | Red | Green | Blue
| | z | | 18.85
| | znorm | | 14.67
| | sky | 14.9 | 14.3 | 14.3
| | S/N | 13.5 | 21.7 | 24.7
| | S/N(c) | 11.4 | 19.9 | 22.4
| | SN(E/C) 0.83
|
| 
| 
| 
| 
| 
|
| 3190057
| 47
| | Red | Green | Blue
| | z | | 18.83
| | znorm | | 14.65
| | sky | 14.8 | 14.3 | 14.6
| | S/N | 12.9 | 21.5 | 24.5
| | S/N(c) | 10.7 | 19.1 | 22.3
| | SN(E/C) 0.86
|
| 
| 
| 
| 
| 
|
| 3190058
| 47
| | Red | Green | Blue
| | z | | 18.44
| | znorm | | 14.26
| | sky | 14.8 | 14.6 | 14.7
| | S/N | 9.6 | 17.3 | 19.5
| | S/N(c) | 8.1 | 15.3 | 17.4
| | SN(E/C) 0.82
|
| 
| 
| 
| 
| 
|
| 3190059
| 47
| | Red | Green | Blue
| | z | | 18.69
| | znorm | | 14.51
| | sky | 14.6 | 14.5 | 14.6
| | S/N | 11.7 | 20.1 | 22.2
| | S/N(c) | 9.4 | 18.4 | 20.0
| | SN(E/C) 0.88
|
| 
| 
| 
| 
| 
|
| 3190060
| 47
| | Red | Green | Blue
| | z | | 18.56
| | znorm | | 14.37
| | sky | 14.6 | 14.4 | 14.7
| | S/N | 10.5 | 18.1 | 20.2
| | S/N(c) | 8.4 | 16.5 | 18.3
| | SN(E/C) 0.89
|
| 
| 
| 
| 
| 
|
| 3190061
| 47
| | Red | Green | Blue
| | z | | 18.61
| | znorm | | 14.43
| | sky | 14.6 | 14.5 | 14.7
| | S/N | 10.7 | 18.8 | 20.5
| | S/N(c) | 8.8 | 16.5 | 18.5
| | SN(E/C) 0.88
|
| 
| 
| 
| 
| 
|
| 3190062
| 47
| | Red | Green | Blue
| | z | | 18.77
| | znorm | | 14.59
| | sky | 14.8 | 14.6 | 14.6
| | S/N | 12.0 | 19.3 | 21.6
| | S/N(c) | 9.8 | 17.6 | 19.6
| | SN(E/C) 0.89
|
| 
| 
| 
| 
| 
|
| 3190063
| 47
| | Red | Green | Blue
| | z | | 18.72
| | znorm | | 14.54
| | sky | 14.9 | 14.5 | 14.5
| | S/N | 10.7 | 18.5 | 19.7
| | S/N(c) | 8.9 | 16.4 | 17.7
| | SN(E/C) 0.79
|
| 
| 
| 
| 
| 
|