| Red | Green | Blue | |
| z | 17.64 | ||
| znorm | Inf | ||
| sky | -Inf | -Inf | -Inf |
| S/N | 19.3 | 35.8 | 39.5 |
| S/N(c) | 0.0 | 0.0 | 0.0 |
| SN(E/C) |
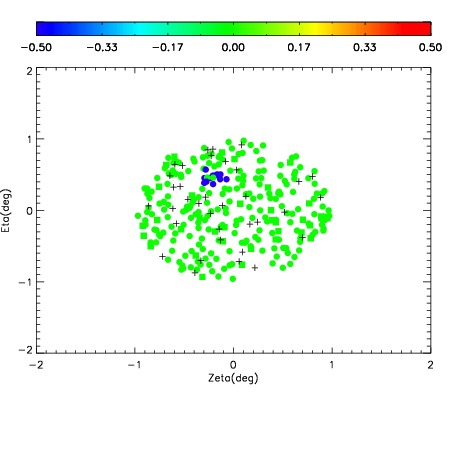
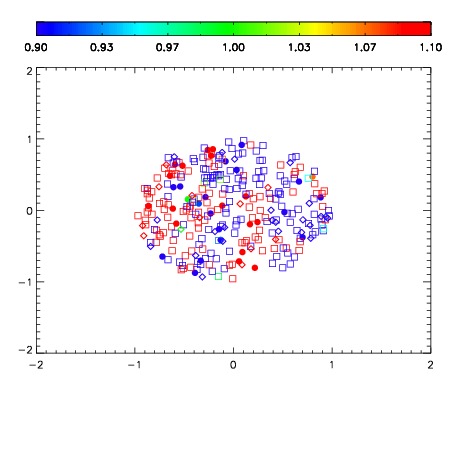
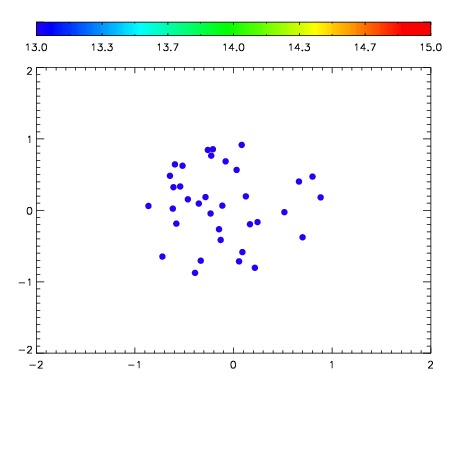

| Frame | Nreads | Zeropoints | Mag plots | Spatial mag deviation | Spatial sky 16325A emission deviations (filled: sky, open: star) | Spatial sky continuum emission | Spatial sky telluric CO2 absorption deviations (filled: H < 10) | |||||||||||||||||||||||
| 0 | 0 |
|
|
|
|
|
|
| IPAIR | NAME | SHIFT | NEWSHIFT | S/N | NAME | SHIFT | NEWSHIFT | S/N |
| 0 | 03190062 | 0.510284 | 0.00000 | 205.293 | 03190056 | 0.00000 | 0.510284 | 203.327 |
| 1 | 03190057 | 0.494578 | 0.0157060 | 202.240 | 03190063 | 0.00184689 | 0.508437 | 201.908 |
| 2 | 03190061 | 0.500476 | 0.00980800 | 187.389 | 03190059 | 9.64934e-05 | 0.510188 | 191.625 |
| 3 | 03190058 | 0.499973 | 0.0103110 | 168.184 | 03190060 | -0.00232005 | 0.512604 | 178.236 |