| Red | Green | Blue | |
| z | 17.64 | ||
| znorm | Inf | ||
| sky | -Inf | -Inf | -Inf |
| S/N | 24.9 | 43.7 | 48.4 |
| S/N(c) | 0.0 | 0.0 | 0.0 |
| SN(E/C) |
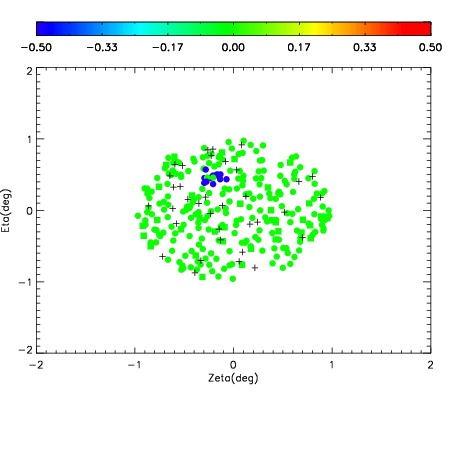
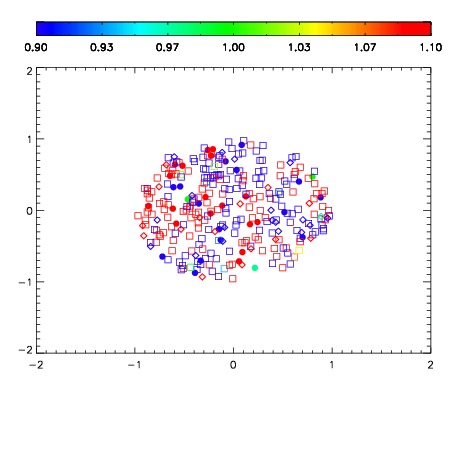
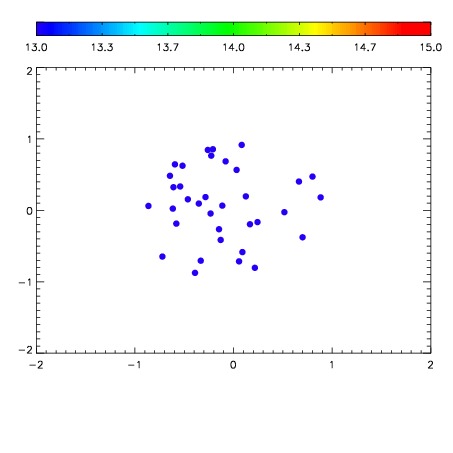

| Frame | Nreads | Zeropoints | Mag plots | Spatial mag deviation | Spatial sky 16325A emission deviations (filled: sky, open: star) | Spatial sky continuum emission | Spatial sky telluric CO2 absorption deviations (filled: H < 10) | |||||||||||||||||||||||
| 0 | 0 |
|
|
|
|
|
|
| IPAIR | NAME | SHIFT | NEWSHIFT | S/N | NAME | SHIFT | NEWSHIFT | S/N |
| 0 | 03200042 | 0.515148 | 0.00000 | 210.909 | 03200039 | 0.00219480 | 0.512953 | 210.720 |
| 1 | 03200038 | 0.509171 | 0.00597697 | 205.184 | 03200040 | 0.00159210 | 0.513556 | 206.991 |
| 2 | 03200041 | 0.505597 | 0.00955099 | 199.394 | 03200043 | 0.00330328 | 0.511845 | 202.309 |
| 3 | 03200037 | 0.503621 | 0.0115270 | 189.705 | 03200036 | 0.00114382 | 0.514004 | 185.112 |
| 4 | 03200034 | 0.508941 | 0.00620699 | 170.308 | 03200035 | 0.00129685 | 0.513851 | 181.888 |
| 5 | 03200033 | 0.507887 | 0.00726098 | 168.861 | 03200032 | 0.00000 | 0.515148 | 149.447 |