| Red | Green | Blue | |
| z | 17.64 | ||
| znorm | Inf | ||
| sky | -Inf | -Inf | -Inf |
| S/N | 23.4 | 41.3 | 47.3 |
| S/N(c) | 0.0 | 0.0 | 0.0 |
| SN(E/C) |
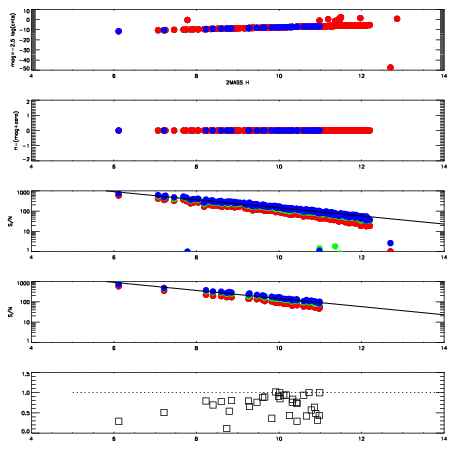
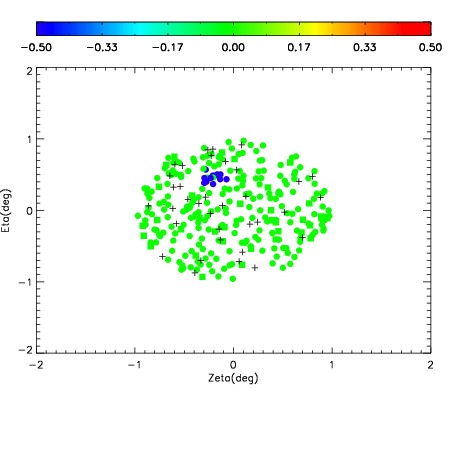
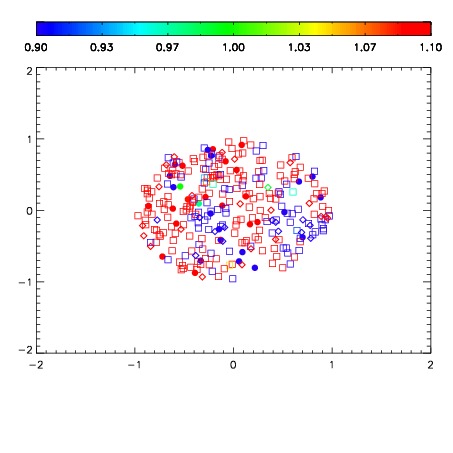
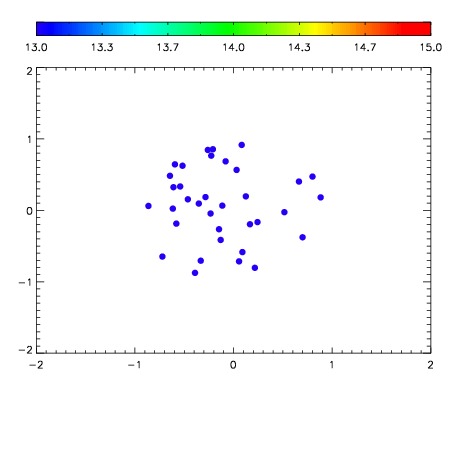

| Frame | Nreads | Zeropoints | Mag plots | Spatial mag deviation | Spatial sky 16325A emission deviations (filled: sky, open: star) | Spatial sky continuum emission | Spatial sky telluric CO2 absorption deviations (filled: H < 10) | |||||||||||||||||||||||
| 0 | 0 |
|
|
|
|
|
|
| IPAIR | NAME | SHIFT | NEWSHIFT | S/N | NAME | SHIFT | NEWSHIFT | S/N |
| 0 | 06650098 | 0.481913 | 0.00000 | 199.207 | 06650100 | -0.00467069 | 0.486584 | 194.344 |
| 1 | 06650094 | 0.480466 | 0.00144699 | 216.304 | 06650095 | -0.000225386 | 0.482138 | 215.998 |
| 2 | 06650093 | 0.480428 | 0.00148499 | 213.300 | 06650092 | 0.00000 | 0.481913 | 211.349 |
| 3 | 06650097 | 0.480959 | 0.000954002 | 207.878 | 06650103 | 8.90366e-05 | 0.481824 | 197.627 |
| 4 | 06650101 | 0.479403 | 0.00251001 | 202.776 | 06650096 | -0.00184964 | 0.483763 | 194.743 |
| 5 | 06650102 | 0.480560 | 0.00135300 | 186.677 | 06650099 | 0.000588369 | 0.481325 | 189.397 |