| Red | Green | Blue | |
| z | 17.64 | ||
| znorm | Inf | ||
| sky | -Inf | -Inf | -Inf |
| S/N | 26.6 | 47.0 | 51.6 |
| S/N(c) | 0.0 | 0.0 | 0.0 |
| SN(E/C) |
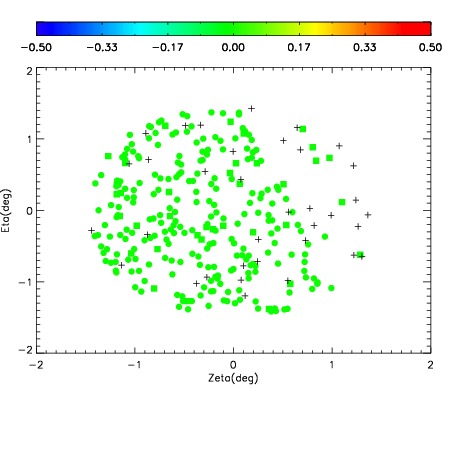

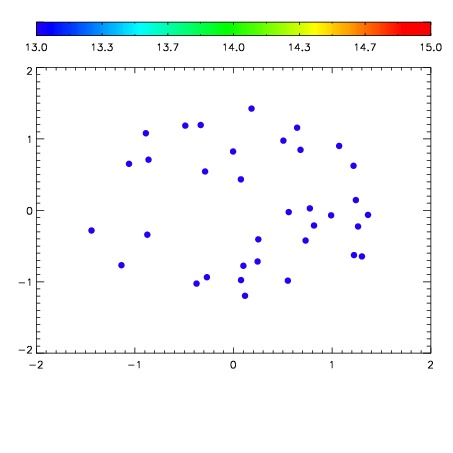

| Frame | Nreads | Zeropoints | Mag plots | Spatial mag deviation | Spatial sky 16325A emission deviations (filled: sky, open: star) | Spatial sky continuum emission | Spatial sky telluric CO2 absorption deviations (filled: H < 10) | |||||||||||||||||||||||
| 0 | 0 |
|
|
|
|
|
|
| IPAIR | NAME | SHIFT | NEWSHIFT | S/N | NAME | SHIFT | NEWSHIFT | S/N |
| 0 | 03180038 | 0.499398 | 0.00000 | 215.713 | 03180040 | 0.00105084 | 0.498347 | 210.415 |
| 1 | 03180037 | 0.493646 | 0.00575200 | 213.973 | 03180036 | 0.00000 | 0.499398 | 209.704 |
| 2 | 03180042 | 0.497872 | 0.00152600 | 210.618 | 03180039 | 0.00109534 | 0.498303 | 208.991 |
| 3 | 03180041 | 0.496093 | 0.00330499 | 206.366 | 03180043 | 0.00230655 | 0.497091 | 202.870 |