| Red | Green | Blue | |
| z | 17.64 | ||
| znorm | Inf | ||
| sky | -Inf | -Inf | -Inf |
| S/N | 18.7 | 34.0 | 36.8 |
| S/N(c) | 0.0 | 0.0 | 0.0 |
| SN(E/C) |
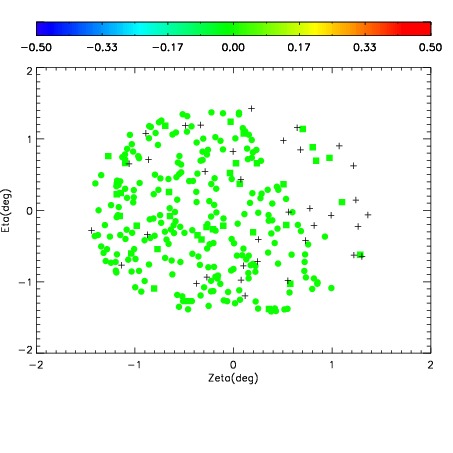
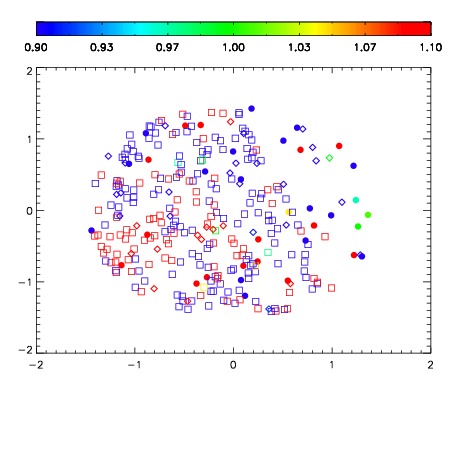
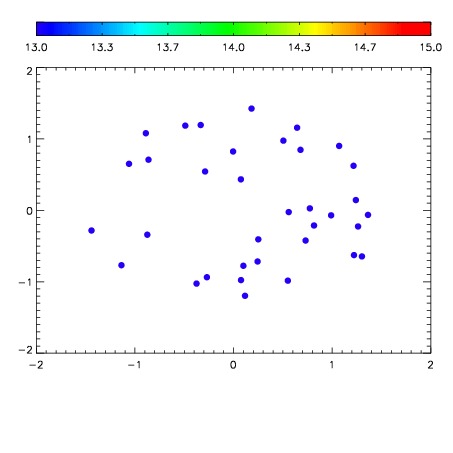

| Frame | Nreads | Zeropoints | Mag plots | Spatial mag deviation | Spatial sky 16325A emission deviations (filled: sky, open: star) | Spatial sky continuum emission | Spatial sky telluric CO2 absorption deviations (filled: H < 10) | |||||||||||||||||||||||
| 0 | 0 |
|
|
|
|
|
|
| IPAIR | NAME | SHIFT | NEWSHIFT | S/N | NAME | SHIFT | NEWSHIFT | S/N |
| 0 | 03770030 | 0.509119 | 0.00000 | 103.363 | 03770029 | 0.00234323 | 0.506776 | 121.182 |
| 1 | 03770026 | 0.504894 | 0.00422496 | 221.910 | 03770032 | 0.00282238 | 0.506297 | 205.818 |
| 2 | 03770027 | 0.506927 | 0.00219196 | 185.184 | 03770025 | 0.00000 | 0.509119 | 198.142 |
| 3 | 03770031 | 0.509003 | 0.000115991 | 148.075 | 03770028 | 0.00263921 | 0.506480 | 141.474 |