| Red | Green | Blue | |
| z | 17.64 | ||
| znorm | Inf | ||
| sky | -Inf | -Inf | -Inf |
| S/N | 27.9 | 49.0 | 53.8 |
| S/N(c) | 0.0 | 0.0 | 0.0 |
| SN(E/C) |
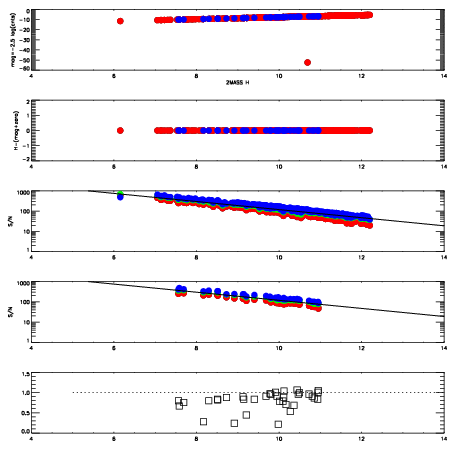
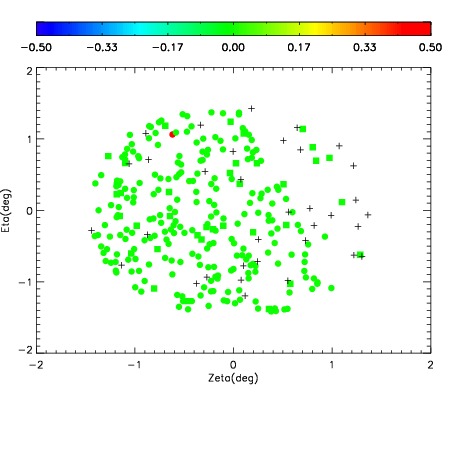
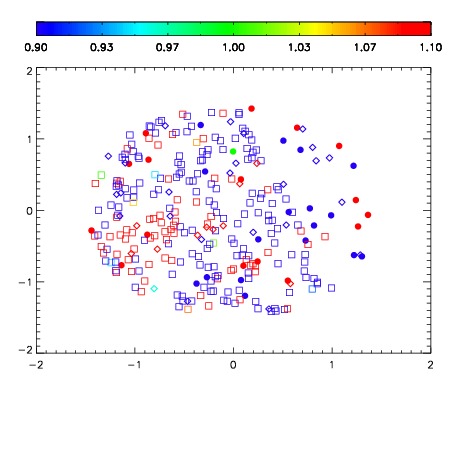
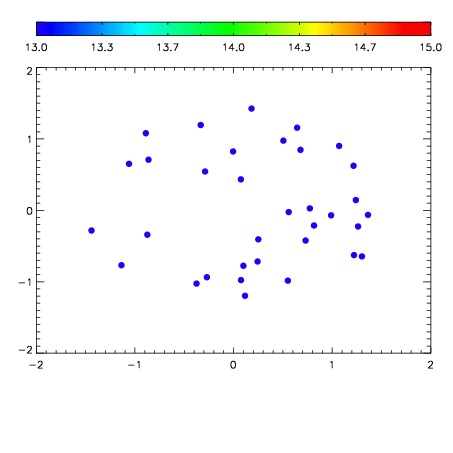

| Frame | Nreads | Zeropoints | Mag plots | Spatial mag deviation | Spatial sky 16325A emission deviations (filled: sky, open: star) | Spatial sky continuum emission | Spatial sky telluric CO2 absorption deviations (filled: H < 10) | |||||||||||||||||||||||
| 0 | 0 |
|
|
|
|
|
|
| IPAIR | NAME | SHIFT | NEWSHIFT | S/N | NAME | SHIFT | NEWSHIFT | S/N |
| 0 | 03980047 | 0.491359 | 0.00000 | 233.734 | 03980049 | -0.00269258 | 0.494052 | 227.671 |
| 1 | 03980050 | 0.489436 | 0.00192299 | 228.012 | 03980048 | -0.00244624 | 0.493805 | 226.709 |
| 2 | 03980046 | 0.491165 | 0.000193983 | 227.966 | 03980045 | 0.00000 | 0.491359 | 223.946 |
| 3 | 03980051 | 0.490894 | 0.000465006 | 202.145 | 03980052 | -0.00238607 | 0.493745 | 218.878 |