| Red | Green | Blue | |
| z | 17.64 | ||
| znorm | Inf | ||
| sky | -Inf | -Inf | -Inf |
| S/N | 33.5 | 56.6 | 62.7 |
| S/N(c) | 0.0 | 0.0 | 0.0 |
| SN(E/C) |
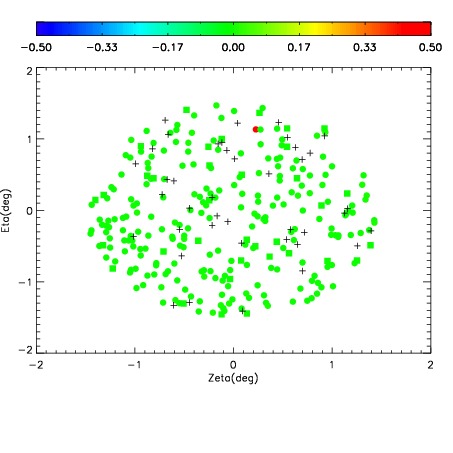
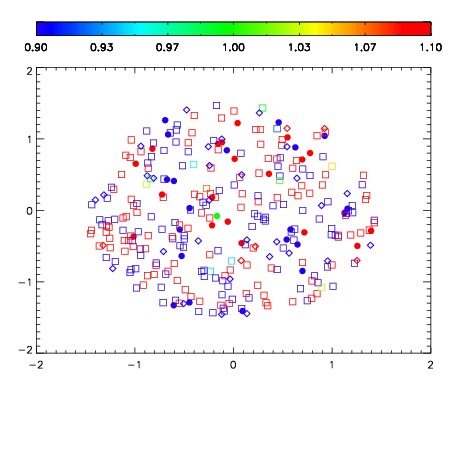


| Frame | Nreads | Zeropoints | Mag plots | Spatial mag deviation | Spatial sky 16325A emission deviations (filled: sky, open: star) | Spatial sky continuum emission | Spatial sky telluric CO2 absorption deviations (filled: H < 10) | |||||||||||||||||||||||
| 0 | 0 |
|
|
|
|
|
|
| IPAIR | NAME | SHIFT | NEWSHIFT | S/N | NAME | SHIFT | NEWSHIFT | S/N |
| 0 | 04040042 | 0.496191 | 0.00000 | 230.623 | 04040040 | 0.000303694 | 0.495887 | 228.755 |
| 1 | 04040037 | 0.494287 | 0.00190398 | 238.139 | 04040043 | -0.000647808 | 0.496839 | 237.752 |
| 2 | 04040038 | 0.494294 | 0.00189701 | 238.015 | 04040039 | 0.000825052 | 0.495366 | 235.023 |
| 3 | 04040041 | 0.495614 | 0.000577003 | 232.280 | 04040036 | 0.00000 | 0.496191 | 234.704 |