| Red | Green | Blue | |
| z | 17.64 | ||
| znorm | Inf | ||
| sky | -Inf | -Inf | -Inf |
| S/N | 30.0 | 51.5 | 56.9 |
| S/N(c) | 0.0 | 0.0 | 0.0 |
| SN(E/C) |

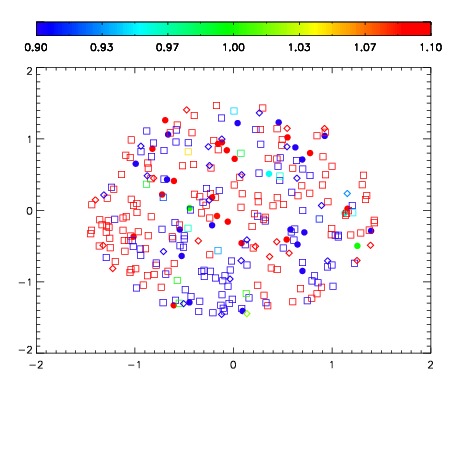
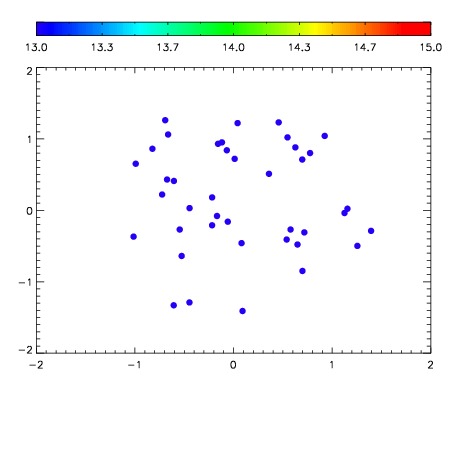

| Frame | Nreads | Zeropoints | Mag plots | Spatial mag deviation | Spatial sky 16325A emission deviations (filled: sky, open: star) | Spatial sky continuum emission | Spatial sky telluric CO2 absorption deviations (filled: H < 10) | |||||||||||||||||||||||
| 0 | 0 |
|
|
|
|
|
|
| IPAIR | NAME | SHIFT | NEWSHIFT | S/N | NAME | SHIFT | NEWSHIFT | S/N |
| 0 | 06750038 | 0.489596 | 0.00000 | 230.734 | 06750040 | -0.00208465 | 0.491681 | 234.727 |
| 1 | 06750037 | 0.488522 | 0.00107402 | 235.546 | 06750043 | -0.00286691 | 0.492463 | 236.810 |
| 2 | 06750042 | 0.489180 | 0.000416011 | 234.691 | 06750039 | -0.00115879 | 0.490755 | 235.538 |
| 3 | 06750041 | 0.488206 | 0.00139001 | 230.363 | 06750036 | 0.00000 | 0.489596 | 229.614 |